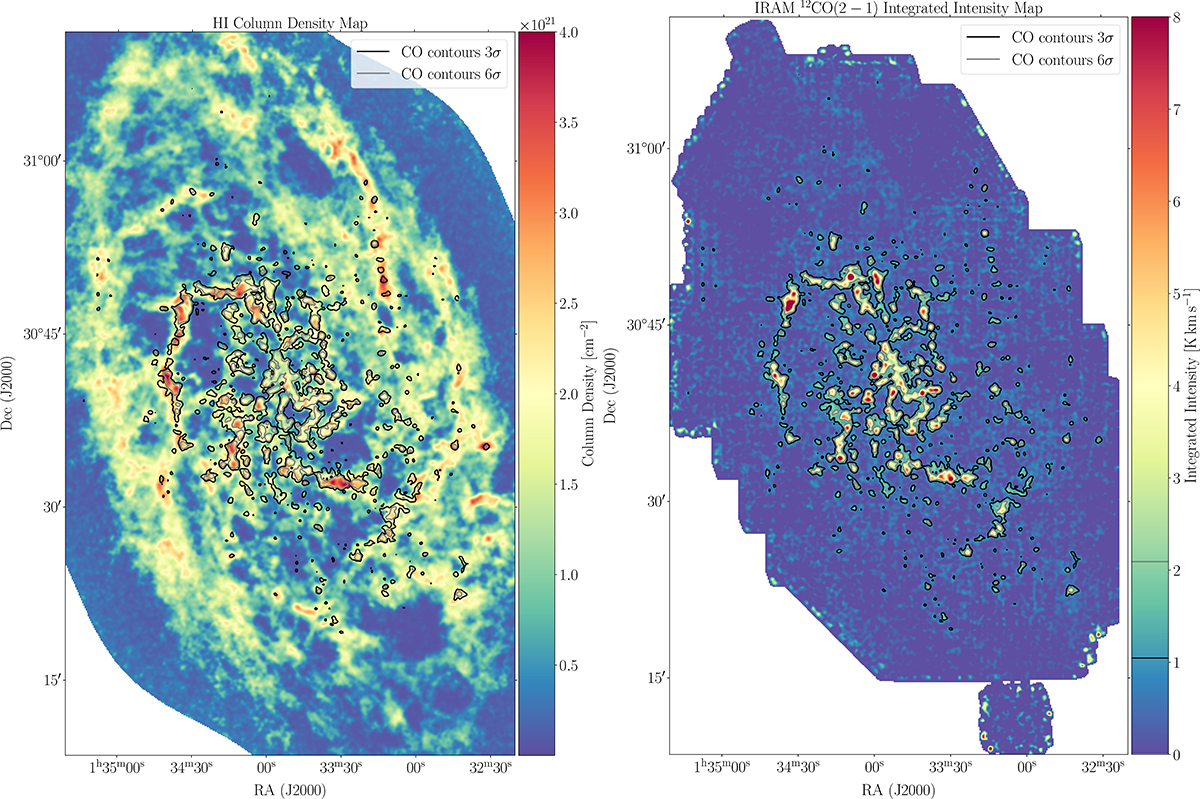
Fig. 1.
Download original image
NH I and CO line-integrated intensity map. Left: H I column density map determined from VLA H I observations (Gratier et al. 2010). Right: IRAM 30 m CO(2 − 1) line integrated intensity map of M33 (Druard et al. 2014). The lines in the colour bar mark the 3σ and 6σ values of CO emission. Both maps are smoothed to a resolution of 18.2″ and re-gridded to a pixel size of 6″. CO contours at 3 and 6σ are overlaid on both maps.
Current usage metrics show cumulative count of Article Views (full-text article views including HTML views, PDF and ePub downloads, according to the available data) and Abstracts Views on Vision4Press platform.
Data correspond to usage on the plateform after 2015. The current usage metrics is available 48-96 hours after online publication and is updated daily on week days.
Initial download of the metrics may take a while.