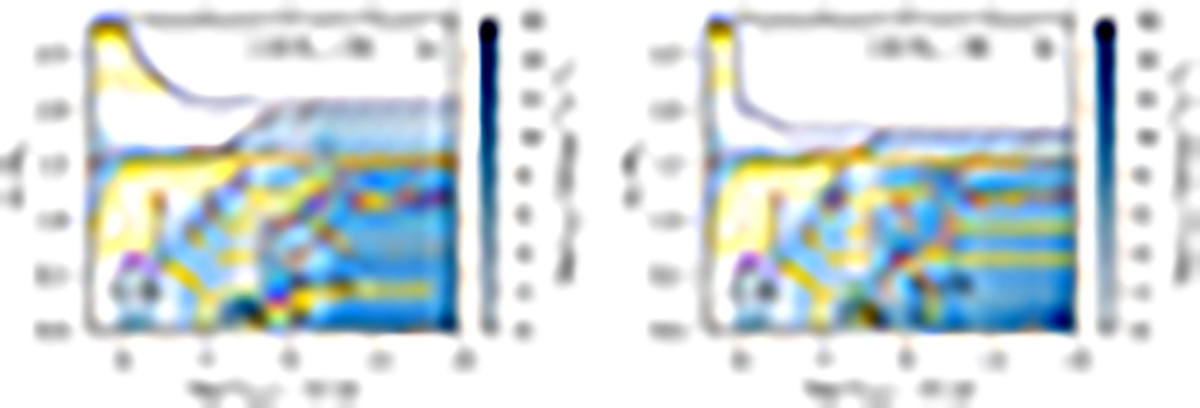
Fig. 7.
Download original image
Kippenhahn diagram of the RSG remnant of 2.80 M⊙ with a BH and NS companion after the CE phase. The evolution of the interior of the RSG remnants through MT to a BH and NS companion are shown in the panel a and panel b, respectively, as a function of the remaining time until central Si depletion (Si mass fraction < 10−3). The blue colours indicate the intensity of nuclear energy production. Convection, convective overshooting, semi-convection, and thermohaline mixing are marked with grey, purple, brown, and yellow hatched zones, respectively. The red and green dotted lines denote the C and O core boundaries.
Current usage metrics show cumulative count of Article Views (full-text article views including HTML views, PDF and ePub downloads, according to the available data) and Abstracts Views on Vision4Press platform.
Data correspond to usage on the plateform after 2015. The current usage metrics is available 48-96 hours after online publication and is updated daily on week days.
Initial download of the metrics may take a while.