Fig. 5.
Download original image
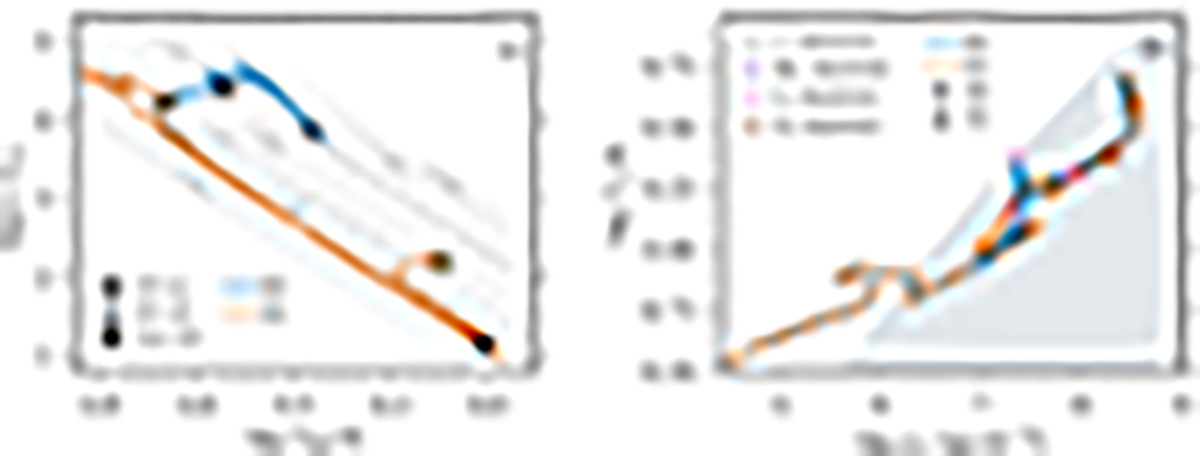
Evolutionary tracks of RSG remnants with a BH and NS companion in the Hertzsprung–Russell diagram (panel a) and in the plane of central temperature versus central density (panel b). The solid blue and dashed orange lines in panel a indicate the evolutionary tracks of RSG remnants undergoing MT to a BH and NS companion, respectively. The black cross represents the RSG remnant at the end of the CE phase, namely the start of evolutionary tracks. The onset and termination of MT are marked with symbols of stars and triangles, respectively. Constant radii are shown by grey lines, among which the dash-dotted lines are the Roche lobe radii given the initial configuration of the post-CE binaries. In panel b, different colours mark the evolutionary points at which the corresponding abundance depletes in the centre of stars. The grey zone indicates the centre of the core is in an electron degenerate state.
Current usage metrics show cumulative count of Article Views (full-text article views including HTML views, PDF and ePub downloads, according to the available data) and Abstracts Views on Vision4Press platform.
Data correspond to usage on the plateform after 2015. The current usage metrics is available 48-96 hours after online publication and is updated daily on week days.
Initial download of the metrics may take a while.