Fig. 10.
Download original image
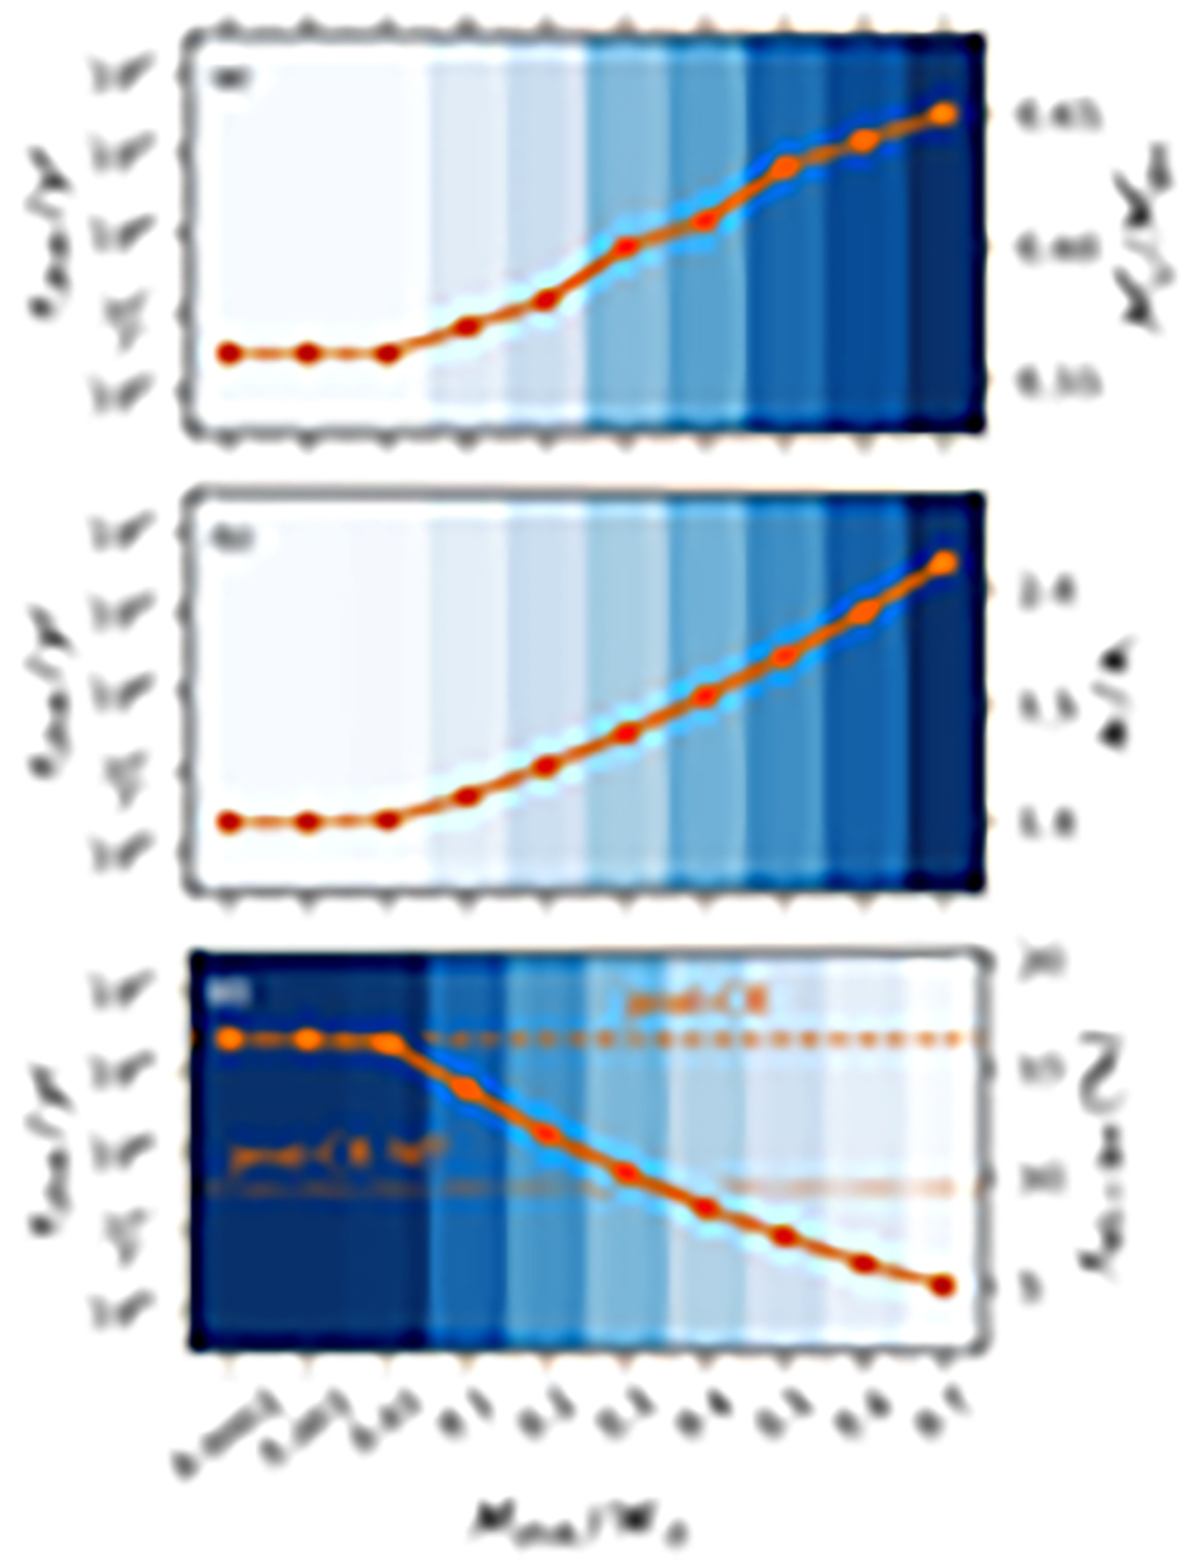
Final mass ratio, final separation with respect to its initial value, and GW merger fraction after the SN explosion for 2.80 M⊙ + BH binary systems after mass accretion from CBD models with different masses (bottom scale) and lifetimes (left scale). The darker blue colour indicates higher value, which is quantified by orange circle symbols (right scale). For comparison, the dashed orange line in panel c indicates the NS-BH merger fraction of ∼16% for the post-CE binary without any interactions, and the merger fraction of ∼9% for the post-CE-MT binary is denoted by the dotted line.
Current usage metrics show cumulative count of Article Views (full-text article views including HTML views, PDF and ePub downloads, according to the available data) and Abstracts Views on Vision4Press platform.
Data correspond to usage on the plateform after 2015. The current usage metrics is available 48-96 hours after online publication and is updated daily on week days.
Initial download of the metrics may take a while.