Fig. 2.
Download original image
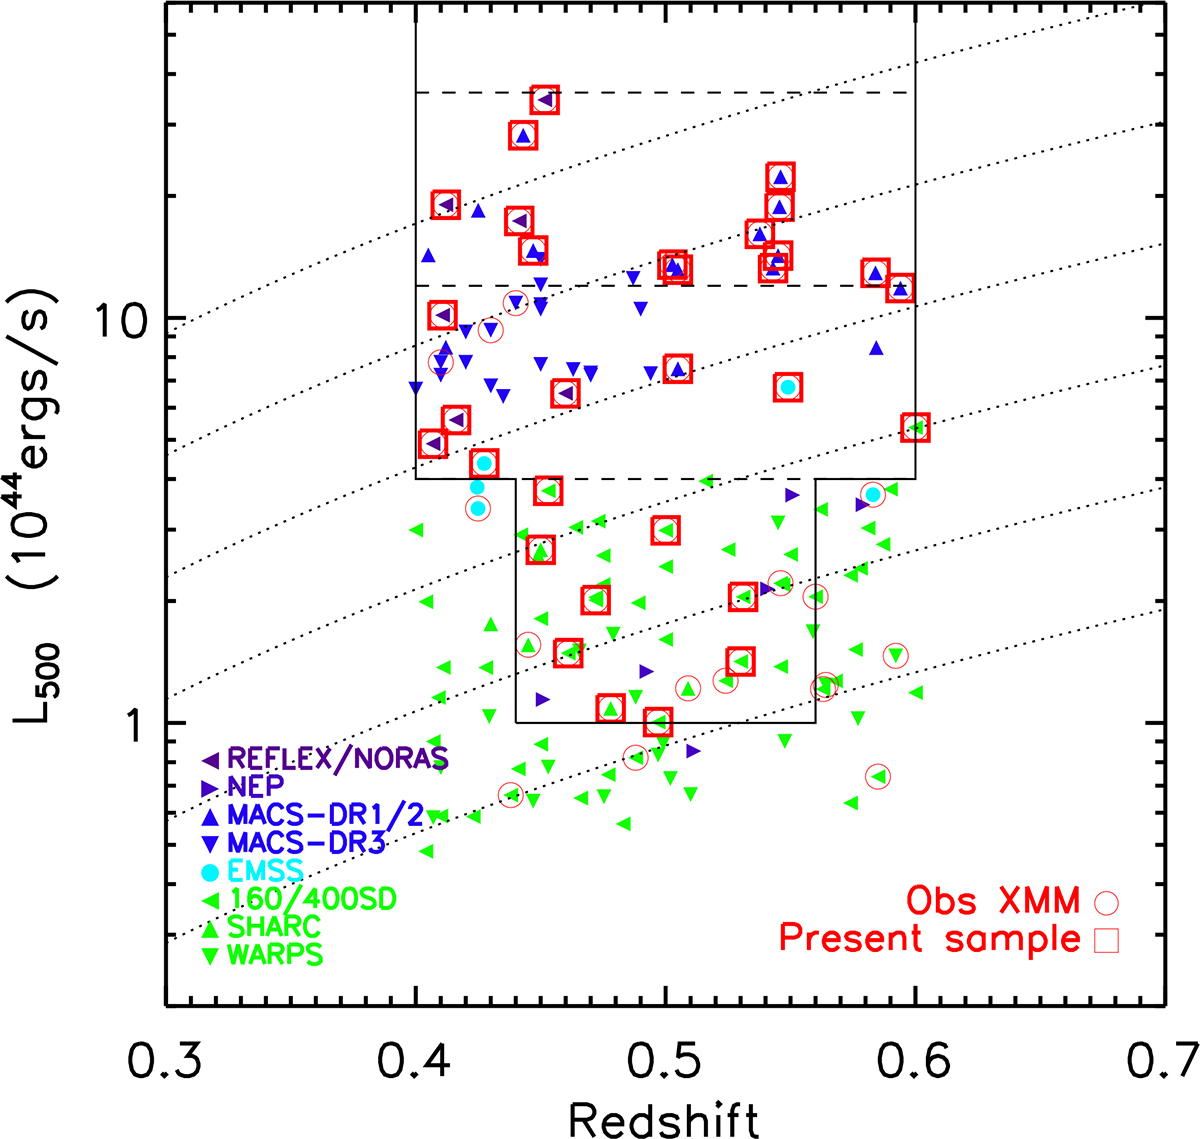
Distribution of the MCXC clusters in the z–L500 plane (Piffaretti et al. 2011). Redshift and L500, the luminosity within R500, are from the updated MCXC catalogue (Sadibekova et al. 2024). Each cluster is colour-coded according to the survey from which the luminosity is taken. Clusters with XMM-Newton observations are marked with red circles and those included in the EXCPReS sample are marked with red boxes. The dotted lines mark the [0.1–2.4] keV band flux taking into account the Kz correction for a typical gas temperature of 5 keV. Levels are separated by 2 dex, from 1.25 × 10⁻¹³ up to 4 × 10⁻¹² ergs s−1 cm−2.
Current usage metrics show cumulative count of Article Views (full-text article views including HTML views, PDF and ePub downloads, according to the available data) and Abstracts Views on Vision4Press platform.
Data correspond to usage on the plateform after 2015. The current usage metrics is available 48-96 hours after online publication and is updated daily on week days.
Initial download of the metrics may take a while.