Fig. 10.
Download original image
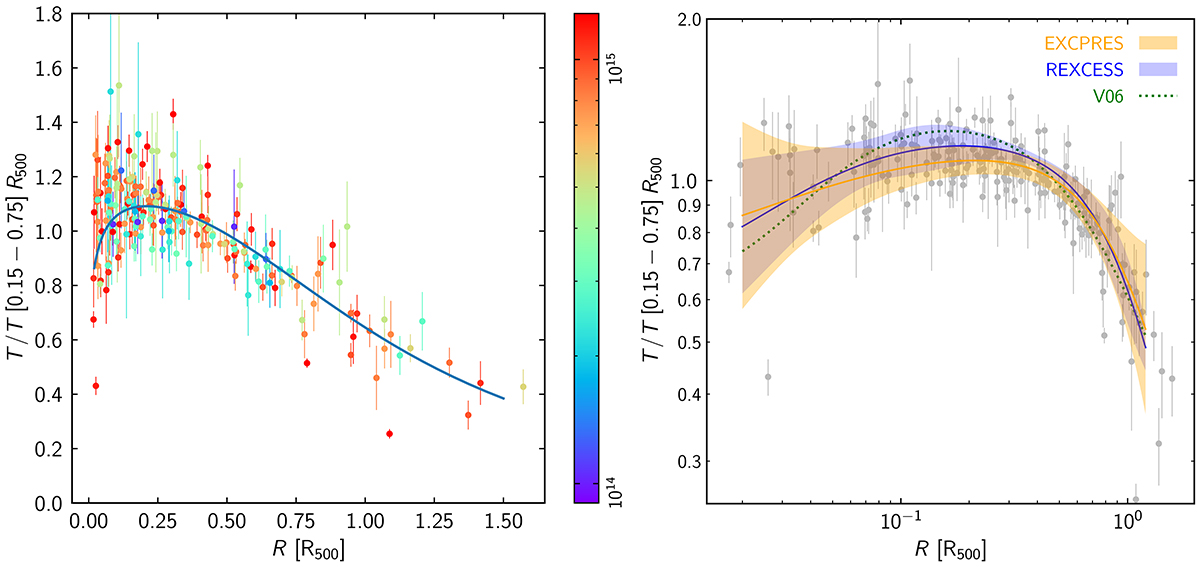
Left: Deconvolved, deprojected, 3D temperature profiles of the EXCPReS sample, scaled by R500 and the spectral temperature in the [0.15 − 0.75] R500 region, colour-coded by total mass. The best-fitting analytical model (Eqs. 2–5) is overplotted. Right: Scaled 3D profiles of the EXCPReS sample (points with error bars) and best-fitting model (orange), compared to the best-fitting model to the scaled temperature profile of the REXCESS sample (blue). Envelopes indicate the radially-varying intrinsic scatter term. The dotted line shows the best-fitting model to the local cool core sample of Vikhlinin et al. (2006).
Current usage metrics show cumulative count of Article Views (full-text article views including HTML views, PDF and ePub downloads, according to the available data) and Abstracts Views on Vision4Press platform.
Data correspond to usage on the plateform after 2015. The current usage metrics is available 48-96 hours after online publication and is updated daily on week days.
Initial download of the metrics may take a while.