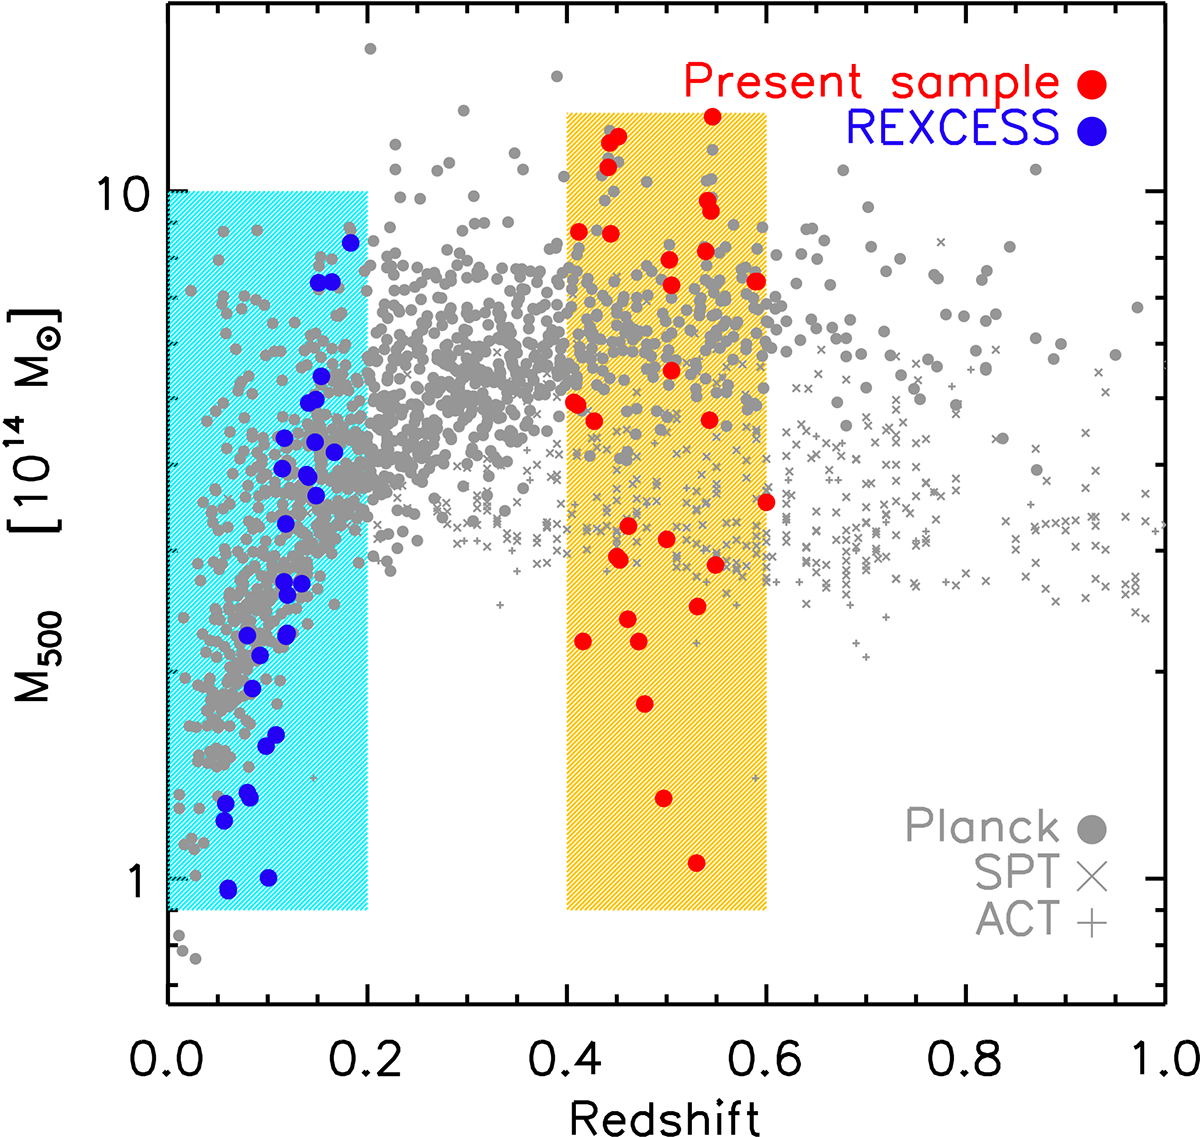
Fig. 1.
Download original image
Distribution in the M − z plane of the EXCPReS sample (red points). The local X-ray-selected REXCESS sample (Böhringer et al. 2007) is shown with blue points. Shown for comparison are confirmed clusters from major SZE surveys from which individual spatially resolved temperature profiles are measurable: Filled circles: Planck clusters (Planck Collaboration VIII 2011; Planck Collaboration XXIX 2014; Planck Collaboration XXVII 2016). Crosses: SPT (Bleem et al. 2015). Plus symbols: ACT (Hasselfield et al. 2013).
Current usage metrics show cumulative count of Article Views (full-text article views including HTML views, PDF and ePub downloads, according to the available data) and Abstracts Views on Vision4Press platform.
Data correspond to usage on the plateform after 2015. The current usage metrics is available 48-96 hours after online publication and is updated daily on week days.
Initial download of the metrics may take a while.