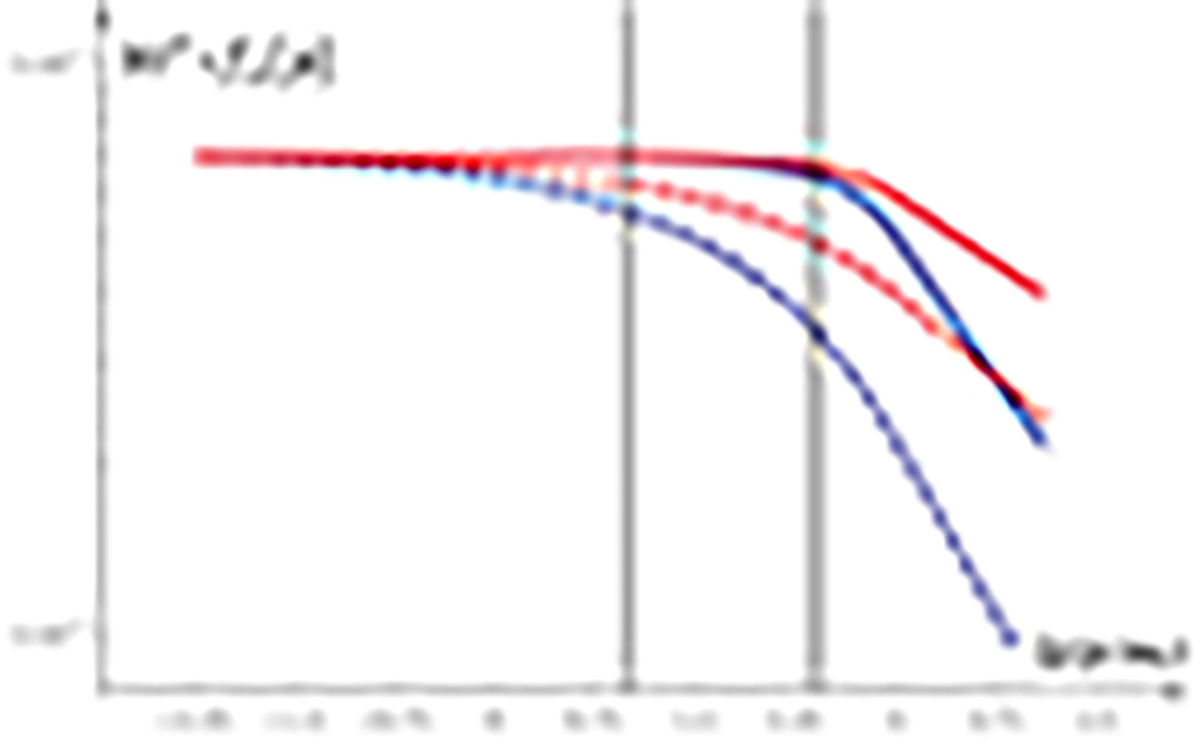
Fig. 7.
Download original image
Distribution functions for the same cases as in Fig. 3. The only difference is the diffusion coefficient. It is the same as in Fig. 3 up to the momentum 0.1pmax and independent of p for higher momenta. Above 0.1pmax, the slopes s for the solid blue and red lines are 2.33 and 2.16, respectively. We note that all the lines will be straight horizontal up to pmax in the case of a uniform flow speed u2(x) = const.
Current usage metrics show cumulative count of Article Views (full-text article views including HTML views, PDF and ePub downloads, according to the available data) and Abstracts Views on Vision4Press platform.
Data correspond to usage on the plateform after 2015. The current usage metrics is available 48-96 hours after online publication and is updated daily on week days.
Initial download of the metrics may take a while.