Fig. 1.
Download original image
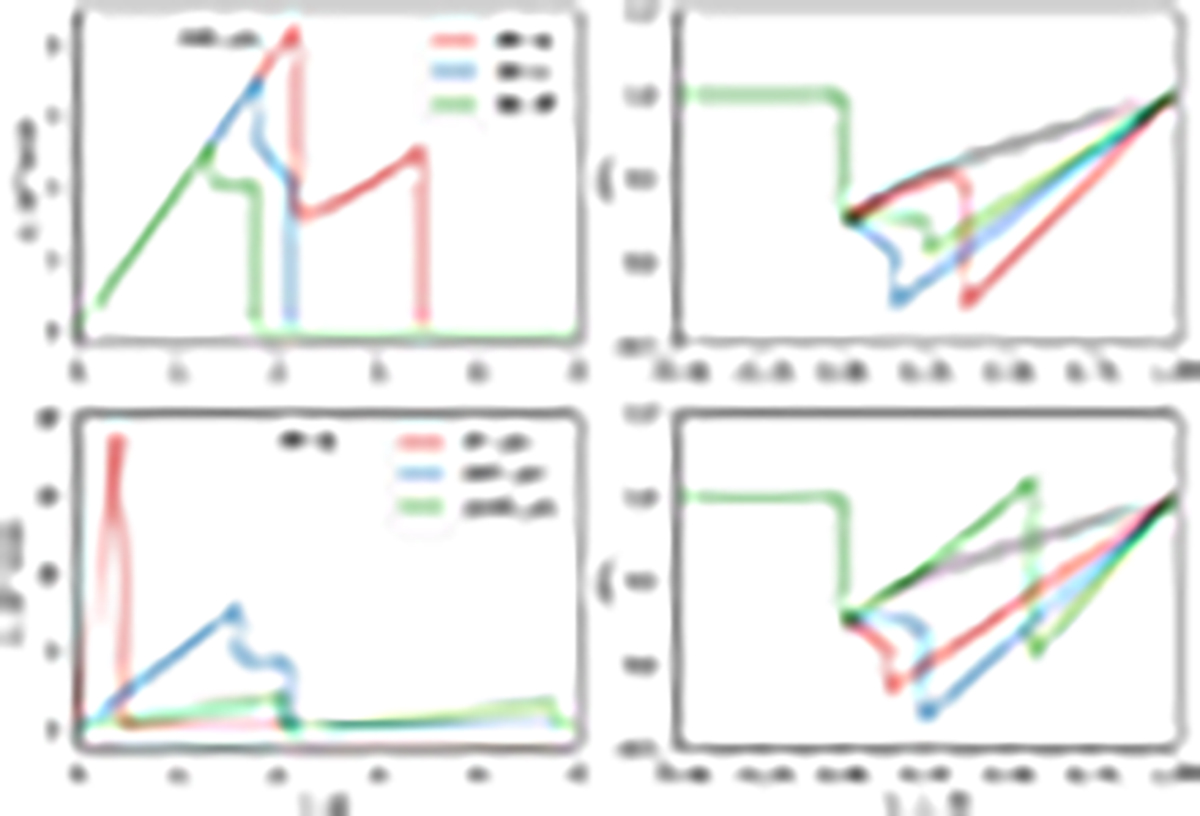
Profiles of the flow velocity v(r) in the observer reference frame (left) and u(x) in the shock reference frame (right) for the three models of SNRs. Upper row: Three SNe models at 500 yr. Lower row: SNIa model at the ages 20, 200, and 1000 yr. On the plots to the left, the explosion centre is at r = 0 with the zero velocity v there. On the plots to the right, the horizontal axes display x = 1 − r/R. Therefore, negative values correspond to the upstream region, whereas positive values correspond to the downstream region. The centre of the explosion on the right-hand side plots is at x = 1, and the velocity u at this point is equal to the upstream velocity u1. We conducted the numerical simulations for the unmodified shocks, and therefore u is spatially constant upstream. The dashed line represents the velocity profile from the Sedov (1959) solution.
Current usage metrics show cumulative count of Article Views (full-text article views including HTML views, PDF and ePub downloads, according to the available data) and Abstracts Views on Vision4Press platform.
Data correspond to usage on the plateform after 2015. The current usage metrics is available 48-96 hours after online publication and is updated daily on week days.
Initial download of the metrics may take a while.