| Issue |
A&A
Volume 687, July 2024
|
|
|---|---|---|
| Article Number | A273 | |
| Number of page(s) | 9 | |
| Section | Stellar structure and evolution | |
| DOI | https://doi.org/10.1051/0004-6361/202450486 | |
| Published online | 18 July 2024 | |
Current and secular accretion rates of EX Hydrae⋆
Institut für Astrophysik und Geophysik, Georg-August-Universität Göttingen, Friedrich-Hund-Platz 1, 37077 Göttingen, Germany
e-mail: This email address is being protected from spambots. You need JavaScript enabled to view it.
Received:
23
April
2024
Accepted:
9
May
2024
Abstract
We report an observed accretion rate of Ṁ1 = (3.86 ± 0.60) × 10−11 M⊙ yr−1 for the white dwarf in the short-period, intermediate polar EX Hya. This result is based upon the accretion-induced 4π-averaged energy flux from 2.45 μm to 100 keV and the corresponding luminosity at the Gaia distance of 56.77 pc. Our result is in perfect agreement with the theoretical mass transfer rate from the secondary star induced by gravitational radiation (GR) and the spin-up of the white dwarf, − Ṁ2 = (3.90 ± 0.35) × 10−11 M⊙ yr−1; 24% of it is caused by the spin-up. The agreement indicates that mass transfer is conservative. The measured Ṁ1 obviates the need for angular momentum loss (AML) by any process other than GR. We complemented this result with an estimate of the mean secular mass transfer rate over ∼107 yr by interpreting the non-equilibrium radius of the secondary star in EX Hya based on published evolutionary calculations. This suggests a time-averaged mass transfer rate enhanced over GR by a factor fGR ≳ 2. Combined with the present-day lack of such an excess, we suggest that an enhanced secular AML is due to an intermittently active process, such as the proposed frictional motion of the binary in the remnants of nova outbursts. We argue that EX Hya, despite its weakly magnetic nature, has evolved in a very similar way to non-magnetic CVs. We speculate that the discontinuous nature of an enhanced secular AML may similarly apply to the latter.
Key words: stars: evolution / novae / cataclysmic variables / stars: individual: EX Hydrae / white dwarfs / X-rays: binaries
Full Table 1 is available at the CDS via anonymous ftp to cdsarc.cds.unistra.fr (130.79.128.5) or via https://cdsarc.cds.unistra.fr/viz-bin/cat/J/A+A/687/A273
© The Authors 2024
 Open Access article, published by EDP Sciences, under the terms of the Creative Commons Attribution License (https://creativecommons.org/licenses/by/4.0), which permits unrestricted use, distribution, and reproduction in any medium, provided the original work is properly cited.
This article is published in open access under the Subscribe to Open model. This email address is being protected from spambots. You need JavaScript enabled to view it. to support open access publication.
1. Introduction
Mass transfer in cataclysmic variables (CV) is driven by angular momentum loss (AML) from the binary orbit. The processes considered in the classical models of CV evolution are magnetic braking at long orbital periods, Porb > 3 h, and gravitational radiation (GR) below the 2 − 3 h period gap (e.g., Rappaport et al. 1982). However, it has become clear that numerous parameters that characterize the CV population are not satisfactorily described by the standard model of binary population studies (e.g., Knigge et al. 2011, henceforth KBP11), among them the degree of bloating of the secondary stars as they are driven out of thermal equilibrium and the effective temperatures of the compressionally heated accreting white dwarfs (WDs). Some of these deficiencies could be remediated by adjusting the relative strength of the secular AML processes below and above the period gap (KBP11, Schreiber et al. 2016; Pala et al. 2017, 2022; Belloni et al. 2018; McAllister et al. 2019). Specifically, below the gap, KBP11 raised the systemic AML from  by GR alone to an average
 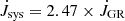 , which characterizes the revised (optimal) model of KBP11. The enhanced mass transfer not only fits the bloated radii of the secondary stars, but it also solved several previously unexplained issues related to binary evolution, greatly increasing the credibility of the approach. The long-term effects are similar for an AML that occurs continuously or in repetitive bursts, as long as the duty cycle of the bursts is shorter than the timescale of the process considered; for instance, the radius inflation. The culprit identified by Schreiber et al. (2016) is frictional motion of the binary in the shells of slow nova outbursts. These events take place in short period CVs roughly every 106 years. This is short enough for all secondaries to share the same radial evolution, but possibly too long a timescale to completely homogenize the temperatures of the compressionally heated WDs.
In this work, we endeavor to shed some light on the origin of the missing AML for the case of the intermediate polar (IP) EX Hya. This disk-accreting binary with an orbital period of 98 min equals in many respects a standard non-magnetic CV, except that its primary is weakly magnetic with a surface field strength B ≃ 0.35 MG (Beuermann & Reinsch 2024, henceforth BR24). We anticipate that it evolves similarly to a non-magnetic CV. Our approach involves an accurate measurement of the current accretion rate of EX Hya via its luminosity that is valid over the last few decades. We confront it with an estimate of the larger secular mean accretion rate obtained from the inflated radius of its secondary star, valid for the last ∼107 yr.
2. Conservative mass transfer with WD spin-up
In this work, we employ the description of conservative mass transfer by Ritter (1985), which includes the variation of the spin angular momenta of WD and secondary star (his Eqs. (1) and (A.19)). The mass transfer rate −Ṁ2 = Ṁ1 is obtained by equating the systemic angular momentum loss of the binary to the sum of the Ṁ1-dependent temporal changes of the orbital and spin angular momenta of the stellar components,  (index 1 for primary and 2 for secondary). Solving for Ṁ1, we obtain:
^{-1/3}+{S\!}_3-{S\!}_2}, \end{aligned} $$](/articles/aa/full_html/2024/07/aa50486-24/aa50486-24-eq4.gif) (1)
(1)
with M = M1 + M2 and the spin-related terms as:
 (2)
(2)
 (3)
(3)
 (4)
(4)
We equate  to
to  , where
 (5)
(5)
is the AML by GR and fGR ≥ 1 accounts for any additional currently active AML process. Of the spin-related terms, S1 describes the accretion of angular momentum by the WD, while S2 and S3 are the effects of the mass transfer-related internal changes of the WD and the companion star, respectively. The quantities P1, Ω1 = 2π/P1, and  are the spin period, angular frequency, and spin-up timescale of the WD, respectively, while ω = Ω2 is the orbital and spin angular frequency of the synchronously rotating secondary star. Then, rg1 and rg2 are the radii of gyration and α1 and α2 the exponents of the power-law mass-radius relations,
  and
and  , for the WD and secondary star, respectively. The mass transfer is significantly enhanced by the loss of orbital angular momentum to spin angular momentum of the WD, but is driven solely by the systemic AML by GR or another process (Ritter 1985). The remaining uncertainty in the calculated accretion rate is determined by the observational errors of M2, α2, M1, and τspin, in this order.
We go on to derive the binary ephemeris expected for a constant spin-up rate  of the WD (Eq. (2)) and the related spin-up timescale, τspin, of the WD. For simplicity, we drop here the subindex 1, indicating the WD. We start from dΩ = qdt and dt = PdE, with E a continuous version of the spin cycle number, obtaining Ω(E) by integration, P(E) by expansion of 2π/Ω(E), and the ephemeris by integration of P(E). This leads to
  and to P = P0 + 2CE + 3DE2 plus higher terms, with Ω0 and P0 the values at E = 0,
  , and
, and  . Integration of dt = PdE starting with t = T0 at E = 0 gives the ephemeris T = T0 + P0E + CE2 + DE3 plus higher terms. Since D is a multiple of C, and all terms from the cubic on are minute, the ephemeris is effectively quadratic. The spin-up timescale is
  , where 2P0E describes the small variation of τspin with E.
2.1. Spin-up timescale of the WD
Kruszewski et al. (1981) discovered the secular decrease of the spin period of EX Hya. The initially suggested values of τspin around 3 Myr were corrected upward to around 5 Myr as more data were accumulated (Mauche et al. 2009; Andronov & Breus 2013). We measured 403 additional spin-maximum times from AAVSO light curves, mostly in the Johnson V-band, using the online tool LCGv21 (Table 1). Of these, a small fraction overlaps with the timings of Breus & Andronov (2013). Two independent spin-maximum times were obtained from light curves taken in 2021 at the Merrimack College (Duston 2023). We accepted the errors of the mixed bag of 435 spin maximum times collected by Mauche et al. (2009), except for ten entries with reported errors down to 4.3 s, which we raised to 1 min or 0.00070 d. The uncertainties of all 403 new timings were estimated at 5.0 min or 0.00347 d. We fit the combined data with the quadratic ephemeris, Tmax = T0 + P0E + CE2, and obtained the spin-up timescale from P0 and C. The fit gives
 (6)
(6)
Spin-maximum times measured from AAVSO light curves, using the tool LCGv2.
with χ2 = 824.4 for 835 degrees of freedom (d.o.f.). The upper panel of Fig. 1 shows the O–C values in BJD (TDB)2 relative to the linear part of the ephemeris, with Mauche’s data in blue, the AAVSO data in red, and the Merrimack points as black dots. The lower panel shows the residuals from the parabolic fit, with rms values of 5.3 min and 4.4 min for Mauche’s data and the AAVSO data, respectively. The spin-up timescale at E = 0 is  yr, resulting in a decrease of the spin period by 47 ms between 1962 and 2023. The quadratic fit is not perfect, displaying small systematic offsets between model and data: it is high by a couple of minutes for the subset of the first 37 maxima observed in the mid-1960s and low by a bit less than a minute for a larger group of data around 1980. This led Mauche et al. (2009) to advocate for a cubic fit. When employed to the present data set, it gives an improved χ2 = 787.2 for 834 d.o.f.; this solution appears to justify the additional parameter. Their fit describes the present data well, but implies a diverging τspin within 100 yr into the future. We consider it more likely that variations in the skewness of the spin light curves and/or differences in the methods of localizing the maxima in noisy light curves are responsible for the O–C offsets of subgroups of the data. We estimate that the true error of parameter C is rather 0.10 × 10⁻¹³, which gives τspin = (5.28 ± 0.10) × 106 yr.
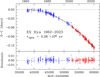 |
Fig. 1. Quadratic term of the parabolic ephemeris of the spin maximum times of EX Hya (top). Blue: data from Mauche et al. (2009). Red and black dots: this work (Table 1, see text). Residuals from the parabolic fit (bottom). |
2.2. System parameters
The component masses were determined by the velocity amplitudes K1 and K2 of the stellar components and the inclination, i, obtained from the duration tecl of the grazing X-ray eclipse of the lower pole of the WD (Beuermann & Osborne 1988). We assumed that the centroid of the X-ray emission is located close to the WD surface, noting that a substantial elevation could lower the derived inclination by up to 0.8°. Table 2 provides an update of the system parameters presented in BR24 and (Beuermann & Reinsch 2008, henceforth BR08). The value of K1 is a weighted mean of the measurements of Belle et al. (2003), Hoogerwerf et al. (2004), Echevarría et al. (2016), and BR24, K1 = 58.9 ± 1.8 km s−1, while K2 = 432.4 ± 4.8 km s−1 is from BR08. The well-defined FWHM of the partial, flat-bottomed 3 − 15 keV X-ray eclipse is tecl = 157 ± 4 s (Mukai et al. 1998). We used the three-dimensional (3D) description of the Roche geometry of Kopal (1959)3. The quoted values of K1, K2, and tecl translate into the parameters listed in Table 2. The inclination, i, and the limiting inclination i0 for no eclipse refer to the center of the WD. Both agree closely indicating that, in fact, the shadow of the secondary star cuts right through the WD.
System parameters of EX Hya.
Our measured primary mass of 0.788 M⊙ is sufficiently close to the 0.75 M⊙ adopted by KBP11 in their evolutionary model calculations to allow their application to EX Hya. The standard and revised model tracks, with AML by GR only and a best-fit enhanced mean secular AML with fGR = 2.47 ± 0.22, respectively, are tabulated as functions of M2 in their Tables 3–8. The revised model provides a best fit to the data, while the standard model fails by 6.6σ (standard deviations) in fGR. For the secondary star in EX Hya, with a mass of 0.1074 M⊙, the standard and revised models predict radii R2 = 0.1451 R⊙ and 0.1512 R⊙, respectively, at the same mass. Its observed radius of 0.1513 ± 0.0022 R⊙ coincides with that of the revised model and formally exceeds that of the standard model by 2.8σ. The agreement in R2 suggests that this mildly magnetic, disk-accreting IP evolved similarly to the sample of non-magnetic CVs and experienced a similarly enhanced secular mass transfer rate. The rates predicted by the standard and revised model tracks are −Ṁ2 = 3.13 × 10⁻¹¹ M⊙ yr−1 and 6.69 × 10⁻¹¹ M⊙ yr−1, respectively (increasing by a factor of 2.14). We expect the latter to represent the mean secular mass transfer rate in EX Hya as well. Given the small difference in R2, it is necessary to consider the systematic uncertainties of the approach, to which we return in Sect. 4.
2.3. Theoretical mass transfer rate −Ṁ2
We calculated the theoretical mass transfer rate from Eqs. (1)–(5), using the system parameters of Table 2, α1 ≃ −1.0 for the heated WD, and the radii of gyration rg1 = 0.423 and rg2 = 0.453 for a polytrope of index 1.5 from Ritter (1985). We adopted the values of α2 from the evolutionary tracks of KBP11 at a mass of 0.1074 R⊙: α2 = 0.764 for the standard model and α2 = 0.690 for the enhanced AML of the revised model (their Tables 5 and 6). For fGR = 1.0, equivalent to the standard model, and  , the transfer rate is −Ṁ2,GR = (2.98 ± 0.27) × 10−11 M⊙ yr−1, in reasonable agreement with the above 3.13 × 10⁻¹¹ M⊙ yr−1 from KBP11. With the observed τspin = (5.28 ± 0.10) × 106 yr, the transfer rate calculated from Eq. (1) rises to (3.90 ± 0.36) × 10−11 M⊙ yr−1, a sizable increase by 31%. The quoted error of the GR-driven rate arises from the observational uncertainties in M2, α2, and M1, in this order. The smaller relative error of the spin-up contribution comes from R1, M1 and least from τspin. With α2 = 0.690 for the revised model track of KBP11, the target rate of −Ṁ2 = 6.69 × 10⁻¹¹ M⊙ yr−1 is obtained for fGR = 2.21 and fGR = 1.88, without and with the spin-up term, respectively.
3. Observational accretion rate Ṁ1
In this section, we detail the tedious procedure of deriving the accretion rate of the WD from the overall spin-averaged spectral energy distribution (SED) of EX Hya. Apart from the secondary star and the WD in its inactive state, all emission components are accretion-induced. Piecing together the SED from non-simultaneous observations is feasible because of the observed lack of long-term variability, which is well documented in the optical region and indicated also for the X-ray regime. The long-term mean V-band flux is used as an anchor-point for the spin-averaged SED and the corresponding integrated energy flux. Obtaining the accretion luminosity, Lacc, requires the conversion of the spin-averaged to the 4π-averaged energy flux (Sect. 3.2.4).
3.1. Long-term mean visual brightness of EX Hydrae
The visual magnitude of EX Hya, monitored by the AAVSO since 19544, demonstrates that it displays little or no long-term variability apart from the infrequent short outbursts. Short-term variability is better documented by the numerous Johnson V-band light curves stored in the AAVSO archive since 2008. On the timescale of hours, the variability is dominated by the spin modulation with a full amplitude of about 0.4 mag. Orbit-to-orbit variability or drifts over weeks occasionally reach 0.3 mag. The long-term variability is still smaller. We studied it on timescales of years and months, using the AAVSO visual and Johnson V-band magnitudes, respectively. In Fig. 2, we show their distributions, excluding in both cases the infrequent short outbursts. The mean quiescent visual magnitude for the years 1954 − 20181 is ⟨Vis⟩ = 13.00 with a standard deviation of 0.07 mag, that of Johnson V for 2009−2023 is ⟨V⟩ = 13.43 with 0.06 mag. EX Hya showed no substantial long-term variability over the last 70 years. For the years of overlap, 2009 − 2018, ⟨V⟩−⟨Vis⟩ = 0.37, implying a long-term mean of ⟨V⟩ = 13.37. Our simultaneous phase-resolved UBVRIJHK photometry of 1982 (BR08), happens to have a spin-averaged V = 13.37 as well. Bath et al. (1981) obtained spectrophotometry with a wide slit between spin phases 0.066 and 0236 that extends from 3300 to 7500 Å. Folding their spectrophotometry through the Johnson V-band filter gives V = 13.44. We corrected the spectral flux upward to match the long-term spin-average of V = 13.37. This is the magnitude we used as the anchor point to calibrate the overall spin-averaged SED.
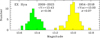 |
Fig. 2. Frequency distribution of the yearly mean AAVSO visual magnitudes of EX Hya outside outbursts (right) and the about monthly mean Johnson V magnitudes (left), displaying the low degree of variability. |
3.2. Spin-averaged spectral energy distribution (SED)
3.2.1. Longward of the Lyman limit
We have previously constructed the spin-averaged SED of EX Hya in its quiescent state for wavelengths between 912 Å and 24 500 Å (BR08; Eisenbart et al. 2002, henceforth EBRG02) and present an update here. Figure 2 shows a smoothed version of the spin-averaged flux-calibrated SED as the black curve labeled OBS. The infrared-optical part is based on our 1995 spectrophotometric observations that were extensively discussed by EBRG02. It was slightly adjusted to match (i) Johnson V = 13.37, (ii) the spectrophotometry of Bath et al. (1981), and (iii) our UBVRIJHK photometry as discussed in the last section. The far-ultraviolet (FUV) part from 912−1830 Å is based on the spin-averaged spectrum measured in 1995 with the Hopkins Ultraviolet Telescope (HUT; Greeley et al. 1997). It has an absolute flux calibration reported to be accurate to 5% and the ORFEUS-SPAS II5 spectra of Mauche (1999) agree reasonably with the HUT spectroscopy. The spectral range between 1830 and 3300 Å was filled with the 1995 ultraviolet (UV) spectra from the International Ultraviolet Explorer (IUE) discussed by EBRG02. Of these, the spin-averaged short-wavelength (SWP) spectrum needed only a small adjustment to match the HUT spectral flux. The mean long-wavelength (LWR) spectrum, for which no sensible spin average exists, smoothly closed the gap between the SWP and the Bath et al fluxes with an adjustment of +30%. The fact that the spectral components from the infrared to the FUV regimes could be readily concatenated indicates that the combined data set represents a reliably defined SED, which we estimate is good to ±10%. The integrated spin-averaged flux between 912 and 24 500 Å normalized to V = 13.37 is Foptuv = (4.51 ± 0.45) × 10−10 erg cm−2 s−1. In Fig. 2, only two components are not of current accretion origin, the secondary star and the compressionally heated WD, represented by the spectrum of the dM star GL473AB divided by 580 (BR08) and a model spectrum of a 12 000 K, log g = 8 WD with solar composition, respectively.
3.2.2. X-rays
The right panel of Fig. 3 shows the X-ray SED, based on published observations or data accessed via NASA’s High Energy Astrophysics Science Archive Research Center (HEASARC)6. The archive provides either fluxes or count rates that we converted to fluxes using the Portable Interactive Multi Mission Simulator (PIMMS)7. We interpreted mean fluxes or count rates of longer observations as spin-averages, although uniform phase coverage could not always be ascertained. The data points in the figure are marked by numbers or letters with further information given in the caption. We used observed fluxes and avoided model-dependent inferred fluxes corrected for sometimes large internal column densities (e.g., Rosen et al. 1991; Ishida et al. 1994b; Yuasa et al. 2010; Hayashi & Ishida 2014). At low photon energies, we either avoided fluxes measured within the broad absorption dip that extends from orbital phase 0.6 to 1.0 (Cordova et al. 1985; Hurwitz et al. 1997; Belle et al. 2002; Hoogerwerf et al. 2005) or we applied an empirical wavelength-dependent correction based on the work of Hoogerwerf et al. (2005). Taken together, the complete sample of non-simultaneous X-ray observations suggests that time variability does not exceed the 10% level.
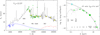 |
Fig. 3. Spin-averaged spectral energy distribution (SED) of EX Hya. Left: ultraviolet to infrared section (smoothed, black curve), spectrophotometry of Bath et al. (1981) (green dots), and our UBVRIJHK photometry (yellow dots). Also shown are the contributions of the secondary star (SEC), the intrinsic emission of the WD, and the radiatively heated polar caps (PC) (see text). Right: X-ray part of the SED. Thin black curve: spectral model absorbed as described in the text. Fat black curve: unabsorbed model. The individual measurements are referenced by numbers and letters: (1) ROSAT PSPC 0.10 − 0.28 keV (HEASARC, footnote 2), (2) Swift 0.3 − 1.0 keV (HEASARC), (3) ROSAT PSPC 0.4 − 2 keV (HEASARC), (4) Swift 1 − 2 keV (HEASARC), (5) EINSTEIN SSS 0.5 − 4.5 keV (Singh & Swank 1993), (6) XMM-Newton 0.3 − 10 keV (Pekön & Balman 2011), (7) ASCA 0.5 − 10 keV (Ishida et al. 1994a), (8) EXOSAT ME 1 − 10 keV (Rosen et al. 1988), (9) Swift 2 − 10 keV (HEASARC), (10) GINGA 2 − 10 keV (Ishida et al. 1994b), (11) GINGA 10 − 20 keV (Ishida et al. 1994b), (12) Suzaku 12 − 40 keV (Yuasa et al. 2010), and (13) NuSTAR 12 − 40 keV (Luna et al. 2018). (a) Cyan blue square: the EUV flux required to explain the observed He IIλ4686 line flux by the Zanstra method (see text). (b) Crosses: the adjusted EXOSAT LE grating spectrum (Cordova et al. 1985) with a typical error attached to a single point. |
We fit these data with a simple spectral model that mimics a cooling flow. It consists of a series of thermal plasma spectra with Gaunt factor and temperatures that range from the shock temperature kTsh down to 1 keV, with the same energy emitted per keV. This prescription disregards post-acceleration within the cooling region and electron and ion temperatures that are not in equilibrium. This is not a physical model, but perfectly serves to calculate the integrated emerging X-ray flux without indulging into the possibly complex modeling of the internal absorption of the more energetic X-rays. Substantial reprocessing undoubtedly occurs and the absorbed X-ray energy reappears in the ultraviolet-optical regime discussed in the previous section.
We corrected the data for the moderate low-energy absorption by (1) an internal neutral absorber of column density NH, int and a partial covering fraction fpc and (2) an interstellar neutral absorber of column density NH, ist = 3 × 10¹⁸ H-atoms cm−2, as defined by the narrow Lyα absorption line in the HST FOS spectra of EX Hya (Eisenbart et al. 2002, their Sect. 5.3). The X-ray spectral fit yields kTsh = (17 ± 2) keV with NH, int = (8.9 ± 1.6) × 1020 H-atoms cm−2 and fpc = 0.63 ± 0.03. The shock temperature corresponds to a shock height of hsh = 0.66 R1 (see the discussion in BR24). The unabsorbed and absorbed model fluxes are shown by the fat and thin solid curves in Fig. 3, respectively. The integrated unabsorbed energy flux is FX − ray = (2.64 ± 0.27) × 10−10 erg cm−2 s−1 for energies between the Lyman limit and 100 keV. The integrated internally absorbed flux is 2.30 × 10⁻¹⁰ erg cm−2 s−1. These numbers agree well with previous measurements of the X-ray flux integrated over 0.1−100 keV: 2.6 × 10⁻¹⁰ erg cm−2 s−1 (Rosen et al. 1991), 2.8 × 10⁻¹⁰ erg cm−2 s−1 (Yuasa et al. 2010), and 2.06 × 10⁻¹⁰ erg cm−2 s−1 (Suleimanov et al. 2019).
3.2.3. EUV range
The transition between the FUV and the X-ray regimes in the intervening extreme ultraviolet (EUV) region is shown in Fig. 4. We discuss this region, referring to a simplified model of the accretion geometry (Fig. 5). At photon energies between 13.6 and ∼90 eV, direct observations of the spectral flux of EX Hya are prevented by interstellar and internal absorption or the intrinsic faintness of the system. Of the total unabsorbed X-ray flux of 2.64 × 10⁻¹⁰ erg cm−2 s−1, only 0.13 × 10⁻¹⁰ erg cm−2 s−1 are from the EUV regime at E < 90 eV. The flux observed in the 90−155 eV interval with the short-wavelength (SW) spectrometer of the Extreme Ultraviolet Explorer (EUVE) is largely lost in the noise except for a few prominent emission lines, such as Fe XVIII/xx λ93.8 and Fe XX/xxiii λ132.8; these probably arise from the lower accretion curtain close to the WD (Hurwitz et al. 1997; Belle et al. 2002). This origin is consistent with the observed negative radial velocity of the 132 Å line at spin maximum (high-ṁ stream in the upper left part of Fig. 5).
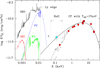 |
Fig. 4. Overall spin-averaged SED of EX Hya, displayed as log (EfE) vs log E. Black curve, labeled OBS: observed spectrum from the K-band to the Lyman edge of Fig. 3, left panel. Red curve, labeled SEC: the secondary star represented by the spectrum of Gl473AB, adjusted by a factor of 580 (BR08). Green curve, labeled WD: spectrum of the compressionally heated WD represented by a model with solar abundances and Teff = 12 000 K (see text). Blue curve, labeled PC: spectrum of the heated pole cap of the WD, represented by a WD spectrum of 25 000 K (see text). The X-ray part of the SED is taken from the right panel of Fig. 3. |
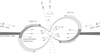 |
Fig. 5. Schematic diagram of the magnetosphere and accretion region (from BR24). Viewing from the left (right) corresponds to spin minimum (maximum) Different shading of gray indicates different levels of the mass flow rate ṁ. The viewing direction for spin maximum and spin minimum are indicated for an inclination of 79° (from BR24). |
No direct measurements of the spectral flux below 90 eV are available. The flux between 54 − 284 eV can, however, be inferred by the Zanstra method (Eisenbart et al. 2002) that relates the He IIλ4686 photon flux to the photoionization and subsequent recombination of He II ions by photons in the noted energy range on the assumption that the He III region is ionization-bounded (see, e.g., Patterson & Raymond 1985, for details). We measured the well-defined spin-resolved He IIλ4686 line fluxes in the 2004 ESO-VLT UVES8 spectra of EX Hya (BR08; BR24) that were slightly adjusted to match the presently adopted flux level. This gave a spin-averaged mean line flux of f4686 = 1.60 × 10⁻¹³ erg cm−2 s−1, taken to respresent also the 4π-average. This line flux requires a mean spectral flux in the 54 − 284 eV interval of 1.25 × 10⁻¹⁰ erg cm−2 s−1 keV−1, assuming optically thin case B recombination with each He II ionizing photon producing 0.26 He IIλ4686 photons (Seaton 1978; Patterson & Raymond 1985). The result is shown as the cyan blue square in Figs. 3 and 4 and almost exactly equals that of the CF model. The error of ±20% is an estimate. The recombination cascade produces the He IIλ1640 ultraviolet line as well, which has a case B line flux about 6.6 times higher than the 4686 Å line (Seaton 1978). We measured the line flux in 36 IUE SWP spectra (EBRG02) and found that it varied quasi-sinusoidally as a function of spin phase, ranging from −0.1 to +1.5 × 10⁻¹² erg cm−2 s−1 between spin minimum and spin maximum, respectively. Contrary to He IIλ4686 Å, the UV line is noticeably affected by internal absorption, preferably near spin minimum, when the inner accretion region is viewed through the densest part of the stream (Fig. 5). A quantitative interpretation requires a more detailed study. Provisionally, we disregard the seven slightly negative line fluxes and use the mean of the 29 positive ones that we accept also as representative of the 4π-average. This gives a mean EUV flux needed to produce the observed 1640 Å line of 1.13 × 10⁻¹⁰ erg cm−2 s−1 keV−1 (open square in Figs. 3 and 4, estimated error ±30%), consistent with, but less reliable, than the value obtained from the 4686 Å line. The combined evidence argues against the existence of a separate soft X-ray component in EX Hya. The large internal column densities in the accretion curtain (e.g., Rosen et al. 1991; Ishida et al. 1994b; Yuasa et al. 2010; Hayashi & Ishida 2014) and the column density of 1.3 × 10²⁰ H-atoms cm−2 cited for the EUV spectrum (Hurwitz et al. 1997; Belle et al. 2002) suggest that the escaping fraction is, in fact, small and the Zanstra method provides a reliable estimate of the emission in the 54−284 eV energy range.
Emission in the hydrogen Lyman continuum between 13.6 and 54.4 eV can neither be measured nor easily be inferred. The FUV emission regions that are expected to contribute to the Lyman continuum are the accretion curtain and the irradiation-heated polar cap, represented in combination by the black curve in Figs. 3 and 4. EBRG02 have quantified the FUV spectral contribution from the heated polar cap in their Fig. 9. The corresponding HST FOS spectral component reaches a peak flux of 7.9 mJy at 1320 Å and is best described by a 25 000 K WD model spectrum with a solar composition and log g = 8 that is modified by the irradiation-induced fill-up of the Lyα absorption line (Gänsicke et al. 1998; Belle et al. 2003). We modeled this spectrum, using calculations of irradiation-heated WD atmospheres by König et al. (2006). These authors considered heating of the polar spot in AM Her by intense cyclotron radiation, which creates a hot corona and allows a sizable Lyman continuum to escape. In EX Hya, the polar cap is instead heated by X-rays, which will affect the atmospheric temperature stratification, but not prevent the creation of a corona. We felt justified, therefore, to adopt a model of König et al. (2006) to represent the polar-cap emission of EX Hya. It is obtained for a peak temperature of the spot of 30 000 K, an effective radius of the emitting spot of 3.8 × 108 cm, and is shown as the blue curve in Figs. 3 and 4. A mean temperature of 25 000 K was previously proposed by Greeley et al. (1997) and Belle et al. (2003) and a two-temperature model by Mauche (1999). The polar-cap emission accounts for the major fraction of the observed emission at 912 Å and we expect a correspondingly large contribution to the Lyman continuum at λ ≤ 911 Å. The curtain emission is the major component at longer wavelengths, but drops below that of the polar-cap at 912 Å. The former is thought to be created in part by the reprocessing of X-rays that hit the inner surface of the accretion stream (Fig. 5). Given that τ911 > 1 for NH > 1017 H-atoms cm−2 and the large column density presented by the stream, escape of Lyman continuum photons from the curtain will be restricted. Finally, we neglected the (likely) faint helium continuum emission between 24.6 and 54.4 eV, marked by a “?” in Fig. 4.
3.2.4. The 4π-averaged energy flux of the WD
An accurate measurement of the accretion luminosity depends on the factor, f4π, which converts the observed spin-averaged flux Fobs to the 4π-averaged flux Facc = f4πFobs and is often approximated as f4π ≃ 1.0. In EX Hya, this assumption is problematic, because of the bright polar caps that are viewed always near the horizon, given the large inclination and the probably small tilt of the magnetic axis, δ ∼ 10° (Kim & Beuermann 1995, 1996; Allan et al. 1998; Eisenbart et al. 2002; Fig. 5). To obtain an overview, we consider the simple model of an aligned rotator emitting anisotropically as F ∝ a0 sin ϕ [1 + 2a1 cos(2θ)], with azimuth (spin phase) ϕ and colatitude θ. This leads to f4π = 1 + (2a1)/3, independent of a0. Only one-third of the full latitude variation 2a1 turns up in f4π and, for a1 = 0, we recover the traditional case of f4π = 1. For the special geometry of EX Hya, considering f4π ≠ 1 is likely important for the polar caps and may be dispensable for the other emission components. To give an example, Norton (1993) calculated X-ray light curves of IPs for a range of inclinations, which show a flux ratio F(θ = 0° )/F(θ = 90° ) ≃ 1.30, implying a1 ≃ 0.15 and f4π ≃ 1.10 for Fobs given by the spin-averaged flux at θ = 90°.
For the large polar caps in EX Hya, that are heated from tall accretion curtains, we assumed a temperature varying sinusoidally between 30 000 K at the pole and 12 000 K at the equator. The factor f4π depends on wavelength and we calculated it numerically for the geometry of EX Hya with i = 79°, assuming blackbody emission. Table 3 lists the flux-averaged values of f4π for the respective wavelength intervals in lines 1 to 3 of Col. 4. For the spectral components originating from the accretion funnels and the disk, we adopted f4π = 1.00 ± 0.10. We assumed an uncertainty of all conversion factors of 10% in calculating F4π, adding it quadratically to the flux error.
Integrated quiescent energy fluxes of the accretion-induced components (lines 1–7) and fluxes of the secondary star and WD (lines 8 and 9).
3.2.5. Outburst correction to Ṁ1
The 4π-averaged integrated quiescent flux in Table 3 (line 7 of Col. 5) still needs a correction for the infrequent outbursts that occur every about 1.5 yr and last typically 2 days. Hellier et al. (2000) found from simultaneous observations in the 1998 outburst that V-band flux and the RXTE9 3 − 15 keV X-ray flux varied similarly over the time interval of overlap. Szkody et al. (2002) found the same for two outbursts of YY Dra. Taking the V-band flux through outburst as a template of the accretion-induced X-ray flux, Hellier et al. (2000) estimated that the outbursts add about 4% to the quiescent accretion rate in EX Hya. We confirm this estimate as follows: The V-band light curve of the 1998 outburst in Fig. 3 of Hellier et al. (2000) has an integral flux of 3.57 × 10⁻⁸ erg cm−2 above the quiescent level of V = 13.37 (or 1.62 × 10⁻¹⁴ erg cm−2 s−1). With one outburst every 1.5 yr, the 3 day long 1998 outburst contributed 4.7% of the inter-outburst V-band flux integrated over 1.5 yr. Individual outbursts last between 1 and 3 days and the more typical contribution of a 2-day outburst would be 3.1%. Given the remaining uncertainties in the number of missed outbursts and the relation between the V-band flux and the accretion rate, we adopted a correction to the quiescent accretion rate of (4 ± 1)%.
3.2.6. The overall picture
The integrated spin-averaged observed energy flux between 912 and 24 450 Å (black curve in Fig. 3) is Fobs = 45.1 × 10⁻¹¹ erg cm−2 s−1, of which 3.1 × 10⁻¹¹ erg cm−2 s−1 are contributed by the secondary star and the 12 000 K WD (Table 3, Col. 3, lines 8 and 9); 17.1 × 10⁻¹¹ erg cm−2 s−1 are from the spectral model of the polar caps (lines 2 and 3). The remaining 24.9 × 10⁻¹¹ erg cm−2 s−1 of the observed flux are assigned to the accretion curtains and the disk (lines 5 and 6). The disk itself is estimated to contribute about 5 × 10⁻¹¹ erg cm−2 s−1 or 6% of the total flux in the bottom line of Table 3, which corresponds to the potential drop between the L1 point and the inner edge of the accretion disk at 9.5 R1 (BR24). Additional accretion-induced components are the integrated observed X-ray flux between the Lyman edge and 100 keV, corrected for interstellar absorption (line 4), and the model-dependent estimate of the Lyman continuum flux of the polar caps (line 1). Part of the Lyman continuum emission is likely to be intercepted by the infalling matter. On the other hand, the FUV emission from the funnel may have its own Lyman continuum, not considered thus far, which may approximately balance out. Accounting for these uncertainties, we assign a 50% error to this component
Of the total accretion-induced flux, less than one-third appears shortward and 2/3 longward of 54 eV, which marks the approximate dividing line between original X-ray emission and largely reprocessed emissions at longer wavelengths. This is in line with the large column densities of internal photoelectric absorption that were employed in discussions of high-energy X-ray observations (e.g., Rosen et al. 1988, 1991; Ishida et al. 1994b; Kim & Beuermann 1995; Allan et al. 1998; Yuasa et al. 2010; Hayashi & Ishida 2014). The principal reprocessing sites for X-rays emitted either upward or downward are the accretion curtains and the WD atmosphere, respectively. Minor reprocessing sites include: the bulge on the accretion disk, the disk itself, and the secondary star. Of the reprocessed emission, more than one half arises from X-rays emitted downward. The efficiency of X-ray heating is supported by the lack of a hard X-ray reflection component (Luna et al. 2018). Furthermore, a sizeable fraction of the upward emitted X-rays escape, as observations show.
The energy balance presented in Table 3 depends a bit on the temperature of the compressionally heated WD. A measurement of its temperature has not been possible so far, because accretion and X-ray heating has never ceased in the past 70 yr of optical coverage10. The temperature expected from compressional heating is in the range of 11 000 − 14 000 K (Townsley & Gänsicke 2009; Pala et al. 2022, KBP11, their Tables 7 and 8), depending on the mean accretion rate over the last ∼105 yr.
3.3. Current accretion rate
The current accretion rate Ṁ1 of EX Hya can be obtained from the observed quiescent accretion-induced flux in Col. 5, line 7 of Table 3 via:
 (7)
(7)
where M1, R1 and d are from Table 2, ΦL1 is the Roche potential in L1, and fob = 1.04 ± 0.01 is the outburst correction. We find Lacc = (3.33 ± 0.39) × 1032 erg s−1. The corresponding accretion rate, valid for the last seven decades, is Ṁ1 = (2.44 ± 0.38) × 1015 g s−1 = (3.86 ± 0.60) × 10−11 M⊙ yr−1, where the error is derived from the observed flux, M1/R1, fob, and d, in this order. The derived rate agrees perfectly with the theoretical mass transfer rate for AML by GR from Sect. 2.3, −Ṁ2 = (3.90 ± 0.36) × 10−11 M⊙ yr−1. The agreement of the two rates indicates that mass transfer over the last 70 yr was conservative and driven by GR alone. It confirms, furthermore, the level of the sizeable spin-up contribution. The agreement of the two rates within their ∼10 − 15% uncertainties is the best result that has so far been obtained observationally for any CV.
Although GR is a continuous process, the actual mass transfer rate, Ṁ2, may vary on a timescale of months and years. Hessman et al. (2000) showed that starspot activity modulates the transfer rate through the inner Lagrangian point. With a typical star spot cycle on the order of a decade, the effect on the mean transfer rate over the last 70 yr is probably small. The accretion rate Ṁ1 displays less variability, because the accretion disk acts as a buffer and the only excursions arise from the infrequent outbursts (Schreiber et al. 2000), may they originate from thermal disk instabilities or mass transfer events (Hellier et al. 1989, 2000; Reinsch & Beuermann 1990). More details are given in Sect. 3.2.5.
3.4. Secular mean accretion rate of EX Hydrae
In Sect. 2.2, we explain that the observed radius of the bloated secondary star in EX Hya agrees perfectly with the prediction of the revised (optimal) model of KBP11. This suggests that the corresponding mass transfer rate of −Ṁ2 = 6.69 × 10⁻¹¹ M⊙ yr−1 of the KBP11 model is expected to represent the secular mean rate of EX Hya as well. Such a high rate is in conflict with the current accretion rate derived in the previous section. Since continuous or variable accretion of the same average magnitude over a secular timescale result in the same bloating, the obvious loophole is a process that is intermittently active. One example is the frictional motion of the binary in slowly expanding nova shells, as suggested by Schreiber et al. (2016).
4. Discussion
In this paper, we obtained for the first time an accurately measured accretion rate of a short-period CV. The derived rate of Ṁ1 = (3.86 ± 0.60) × 10−11 M⊙ yr−1 agrees with the theoretical mass transfer rate of −Ṁ2 = (3.90 ± 0.36) × 10−11 M⊙ yr−1 for AML driven by GR and enhanced by the spin-up of the WD. The latter amounts to a sizable 31% of the rate from GR and the measured combined rate faithfully accounts for the one expected from theory (Ritter 1985). This is our principal result: over the last 70 yr, mass transfer in EX Hya was driven by GR alone with no other AML process contributing significantly. We identified mass transfer as conservative, with at most a small loss of matter from the system (e.g., King & Wynn 1999).
Our second major result concerns the inflated radius of the secondary star in EX Hya that we interpret in terms of the evolutionary calculations of KBP11. These authors showed that the evolution of non-magnetic CVs below the period gap requires a secular AML enhanced over GR by a factor of fGR = (2.47 ± 0.22), leading to radius inflation of the secondary stars with a unique mass-radius relation R2(M2). KBP11 relied largely on data from Ritter & Kolb (2003), a database that was more recently improved by McAllister et al. (2019), confirming the principle results of KBP11. We found that the measured radius of the secondary star in EX Hya, R2 = 0.1513 ± 0.0022 R⊙, coincides with the best fit of the revised model of KBP11 to the observed radii of non-magnetic CVs, namely, R2 = 0.1512 R⊙ at M2 = 0.1074 M⊙. We take this as an indication that the secondary star in EX Hya has experienced a secular evolution closely similar to non-magnetic CVs, with a similar AML and mass-transfer history. If the evolution of non-magnetic CVs is, in fact, characterized by a secular mass transfer enhanced over GR, this would hold similarly for EX Hya, in contrast to its current lack of any activity beyond GR. Hence, if the inflated radii of short-period CVs are indeed the result of a secular mass transfer rate significantly in excess of GR, we can exclude a continuous nature of the process (at least for EX Hya and possibly for non-magnetic CVs as well). This is an interesting prospect that ought to be explored with observational proof.
We consider how definitive these conclusions are. The revised model of KBP11 is characterized by a secular AML increased over GR by the quoted factor fGR = 2.47 ± 0.22. The associated higher mean mass transfer rate leads to a faster evolution (1.2 instead of 2.8 Gyr from M2 = 0.20 to 0.10 M⊙), enhanced compressional heating of the white dwarfs (to 13 500 K instead of 11 400 K), and increased inflation of the secondary stars, as they are driven out of thermal equilibrium. Fitting the theoretical mass-radius relation R2(M2) to the observed radii of non-magnetic CVs defines the revised model of KBP11 and yields the best-fit fGR quoted above. At the same time, the standard model with AML by GR nominally fails by 6.6 standard deviations. Both model tracks start from a secondary star at the lower edge of the period gap with M2 = 0.20 M⊙ and R2 = fRL R2, B98, where R2, B98 is the model radius of a main-sequence star of solar composition at an age of 5 Gyr (Baraffe et al. 1998) and fRL = 1.045 defines the start value of R2. KBP11 derived the 4.5% non-accretion-induced inflation by carefully exploring the rotational and tidal deformation of Roche-lobe filling stars and considering other effects (e.g., irradiation) that might contribute to expansion besides mass loss. At a mass of 0.1074 M⊙, the secondary stars in the standard and revised models have reached radii of 0.1451 R⊙ and 0.1512 R⊙, respectively, differing by 4.2%. While the latter is obtained from the fit to the data, the former may have a systematic error that results from uncertainties in the stellar models, the adopted fRL, and intricacies of the evolutionary calculations. An increased fRL, for instance, would reduce the difference between the two evolutionary scenarios and would not easily be dismissed, if it were the only evidence. The concept of an increased secular AML and accretion rate, however, has solved several long-standing problems of close-binary evolution or led to an improved understanding. These include the location of the period minimum, the number of period bouncers, the orbital period distributions for CV subtypes, the nature and structure of the period gap, the mass distribution of the WDs, their effective temperatures, the space density of CVs, and last not least the inflated radii of the secondary stars (KBP11, Belloni et al. 2018; Inight et al. 2023a; McAllister et al. 2017, 2019; Pala et al. 2017, 2022; Schreiber et al. 2016, 2024). The combined evidence strongly supports the reality of a secular AML that is enhanced over GR. In this larger context, the interpretation of the radius inflation of the secondary stars in short-period CVs fits into the picture and has gained wide support (see, however, Littlefair et al. 2008; Sirotkin & Kim 2010). Over the last decade, the number of available observations has dramatically increased, in particular, by the Sloan Digital Sky Survey (e.g., McAllister et al. 2019; Inight et al. 2023b), calling for an update of the calculations of KBP11. The nature of the added AML is still a matter of debate and our result may contribute to a solution.
The obvious culprits for an intermittently active mass transfer are nova outbursts, which induce a strongly enhanced AML by frictional motion of the binary in the expanding shells every few 106 yr (Schreiber et al. 2016). Nova outbursts are characterized by a sufficiently short duty cycle, required by the rather homogenous effective temperatures of the compressionally heated WDs in non-magnetic short-period CVs; there is just a single drastic outlier, SDSS J153817.35+512338.0 (Pala et al. 2017, 2022), which harbors a much hotter WD than all other stars of the sample. The nova recurrence time is short enough and the adjustment time of the stellar radii long enough, on the order of 107 yr, that the radial inflation proceeds smoothly in the course of the evolution. On the other hand, the nova recurrence time exceeds the Kelvin-Helmholtz timescale of the non-degenerate envelope of the WDs of about 105 yr, suggesting that the WD temperatures may display a larger fluctuation than the radii of the secondaries. This may, in fact, be born out in the sample of non-magnetic CVs (McAllister et al. 2019; Pala et al. 2017, 2022). Hence, the nova hypothesis does gain credibility that is quite distinct from the independent arguments presented by Schreiber et al. (2016).
The actual mass transfer rate in EX Hya is close to the minimal possible one given by GR. It is tempting to think that the current spin-up process started at synchronous rotation, about two million years ago at the present rate. Any increased AML can only have accelerated spin-up. It is furthermore tempting to think that the process that disrupted synchronism was the last nova eruption. The examples of V1500 Cyg (Nova Cygni 1975, Harrison & Campbell 2016, 2018) and V1674 Her (Nova Her 2021, Patterson et al. 2020, 2022) are telling and provide insights into the possible fate of EX Hya. The similarity of the present accretion and synchronization torques in EX Hya and the low dipolar field strength of about 0.7 MG (BR24) indicate that synchronism, if it ever existed, was fragile and vulnerable, quite different from the persistence of the high-field polar V1500 Cyg. Currently, EX Hya is heading for spin equilibrium with Pspin ∼ 350 s, which it is expected to reach in about ten million years.
The description of Sirotkin & Kim (2009), which is based on n = 1.5 polytropes yields only minimally different results.
The number of visual observations of EX Hya in the AAVSO archive declined drastically since 2019 in favor of CCD observations.
Orbiting and Retrievable Far and Extreme Ultraviolet Spectrograph–Shuttle Pallet Satellite II mission.
Ultraviolet and Visual Echelle Spectrograph at Unit 2 of the Very Large Telescope of the European Southern Observatory.
Rossi X-ray Timing Explorer.
If accretion ceases, EX Hya is expected to drop to B = 15.8 (15.4) and V = 15.8 (15.5) for Twd = 12 000 K (14 000 K), respectively.
Acknowledgments
We thank the anonymous referee for the prompt response and helpful comments. We thank, Boris Gänsicke, Coel Hellier, Frederic Hessman, and Andrew Norton for discussions and comments. Andrew Norton thankfully provided us with his 1993 light curve program. We acknowledge with thanks the variable star observations from the AAVSO International Database contributed by observers worldwide and used in this research. We acknowledge the use of the versatile AAVSO on-line tool LCGv2. We acknowledge with thanks the observations from the Merrimack College Astronomical Research Group (MCARG) communicated by Christopher L. Duston. We made use of the HEASARC archive and the PIMMS tool in extracting part of the X-ray data used in Figs. 3b and 4.
References
- Allan, A., Hellier, C., & Beardmore, A. 1998, MNRAS, 295, 167 [CrossRef] [Google Scholar]
- Andronov, I. L., & Breus, V. V. 2013, Astrophysics, 56, 518 [NASA ADS] [CrossRef] [Google Scholar]
- Bailer-Jones, C. A. L., Rybizki, J., Fouesneau, M., et al. 2021, AJ, 161, 147 [NASA ADS] [CrossRef] [Google Scholar]
- Baraffe, I., Chabrier, G., Allard, F., & Hauschildt, P. H. 1998, A&A, 337, 403 [Google Scholar]
- Bath, G. T., Pringle, J. E., & Whelan, J. A. J. 1981, MNRAS, 190, 185 [Google Scholar]
- Belle, K. E., Howell, S. B., Sirk, M. M., & Huber, E. 2002, ApJ, 577, 359 [NASA ADS] [CrossRef] [Google Scholar]
- Belle, K. E., Howell, S. B., Sion, E. M., Long, K. S., & Szkody, P. 2003, ApJ, 587, 373 [NASA ADS] [CrossRef] [Google Scholar]
- Belloni, D., Schreiber, M. R., Zorotovic, M., et al. 2018, MNRAS, 478, 5626 [NASA ADS] [CrossRef] [Google Scholar]
- Beuermann, K., & Osborne, J. P. 1988, A&A, 189, 128 [NASA ADS] [Google Scholar]
- Beuermann, K., & Reinsch, K. 2008, A&A, 480, 199 (BR08) [NASA ADS] [CrossRef] [EDP Sciences] [Google Scholar]
- Beuermann, K., & Reinsch, K. 2024, A&A, 686, A304 (BR24) [NASA ADS] [CrossRef] [EDP Sciences] [Google Scholar]
- Breus, V. V., & Andronov, I. L. 2013, Odessa Astron. Publ., 26, 35 [Google Scholar]
- Cordova, F. A., Mason, K. O., & Kahn, S. M. 1985, MNRAS, 212, 447 [NASA ADS] [CrossRef] [Google Scholar]
- Duston, C. L. 2023, Observations from The Merrimack College Astronomical Research Group (MCARG), https://sites.google.com/merrimack.edu/mcarg [Google Scholar]
- Eastman, J., Siverd, R., & Gaudi, B. S. 2010, PASP, 122, 935 [Google Scholar]
- Echevarría, J., Ramírez-Torres, A., Michel, R., et al. 2016, MNRAS, 461, 1576 [CrossRef] [Google Scholar]
- Eisenbart, S., Beuermann, K., Reinsch, K., & Gänsicke, B. T. 2002, A&A, 382, 984 [NASA ADS] [CrossRef] [EDP Sciences] [Google Scholar]
- Gänsicke, B. T., Hoard, D. W., Beuermann, K., et al. 1998, A&A, 338, 933 [Google Scholar]
- Greeley, B. W., Blair, W. P., Long, K. S., & Knigge, C. 1997, ApJ, 488, 419 [NASA ADS] [CrossRef] [Google Scholar]
- Harrison, T. E., & Campbell, R. K. 2016, MNRAS, 459, 4161 [NASA ADS] [CrossRef] [Google Scholar]
- Harrison, T. E., & Campbell, R. K. 2018, MNRAS, 474, 1572 [NASA ADS] [CrossRef] [Google Scholar]
- Hayashi, T., & Ishida, M. 2014, MNRAS, 441, 3718 [NASA ADS] [CrossRef] [Google Scholar]
- Hellier, C., Mason, K. O., Smale, A. P., et al. 1989, MNRAS, 238, 1107 [NASA ADS] [CrossRef] [Google Scholar]
- Hellier, C., Kemp, J., Naylor, T., et al. 2000, MNRAS, 313, 703 [NASA ADS] [CrossRef] [Google Scholar]
- Hessman, F. V., Gänsicke, B. T., & Mattei, J. A. 2000, A&A, 361, 952 [NASA ADS] [Google Scholar]
- Hoogerwerf, R., Brickhouse, N. S., & Mauche, C. W. 2004, ApJ, 610, 411 [NASA ADS] [CrossRef] [Google Scholar]
- Hoogerwerf, R., Brickhouse, N. S., & Mauche, C. W. 2005, ApJ, 628, 946 [NASA ADS] [CrossRef] [Google Scholar]
- Hurwitz, M., Sirk, M., Bowyer, S., & Ko, Y.-K. 1997, ApJ, 477, 390 [NASA ADS] [CrossRef] [Google Scholar]
- Inight, K., Gänsicke, B. T., Schwope, A., et al. 2023a, MNRAS, 525, 3597 [NASA ADS] [CrossRef] [Google Scholar]
- Inight, K., Gänsicke, B. T., Breedt, E., et al. 2023b, MNRAS, 524, 4867 [NASA ADS] [CrossRef] [Google Scholar]
- Ishida, M., Mukai, K., & Osborne, J. P. 1994a, PASJ, 46, L81 [NASA ADS] [Google Scholar]
- Ishida, M., Makishima, K., Mukai, K., et al. 1994b, MNRAS, 266, 367 [NASA ADS] [CrossRef] [Google Scholar]
- Kim, Y., & Beuermann, K. 1995, A&A, 298, 165 [NASA ADS] [Google Scholar]
- Kim, Y., & Beuermann, K. 1996, A&A, 307, 824 [NASA ADS] [Google Scholar]
- King, A. R., & Wynn, G. A. 1999, MNRAS, 310, 203 [NASA ADS] [CrossRef] [Google Scholar]
- Knigge, C., Baraffe, I., & Patterson, J. 2011, ApJS, 194, 28 [Google Scholar]
- König, M., Beuermann, K., & Gänsicke, B. T. 2006, A&A, 449, 1129 [NASA ADS] [CrossRef] [EDP Sciences] [Google Scholar]
- Kopal, Z. 1959, The International Astrophysics Series (London: Chapman& Hall) [Google Scholar]
- Kruszewski, A., Mewe, R., Heise, J., et al. 1981, Space Sci. Rev., 30, 221 [NASA ADS] [CrossRef] [Google Scholar]
- Littlefair, S. P., Dhillon, V. S., Marsh, T. R., et al. 2008, MNRAS, 388, 1582 [NASA ADS] [CrossRef] [Google Scholar]
- Luna, G. J. M., Mukai, K., Orio, M., et al. 2018, ApJ, 852, L8 [NASA ADS] [CrossRef] [Google Scholar]
- Mauche, C. W. 1999, ApJ, 520, 822 [NASA ADS] [CrossRef] [Google Scholar]
- Mauche, C. W., Brickhouse, N. S., Hoogerwerf, R., et al. 2009, Inf. Bull. Var. Stars, 5876, 1 [NASA ADS] [Google Scholar]
- McAllister, M. J., Littlefair, S. P., Dhillon, V. S., et al. 2017, MNRAS, 467, 1024 [NASA ADS] [CrossRef] [Google Scholar]
- McAllister, M., Littlefair, S. P., Parsons, S. G., et al. 2019, MNRAS, 486, 5535 [NASA ADS] [CrossRef] [Google Scholar]
- Mukai, K., Ishida, M., Osborne, J. P., et al. 1998, ASP Conf. Ser., 137, 554 [NASA ADS] [Google Scholar]
- Norton, A. J. 1993, MNRAS, 265, 316 [NASA ADS] [CrossRef] [Google Scholar]
- Pala, A. F., Gänsicke, B. T., Townsley, D., et al. 2017, MNRAS, 466, 2855 [NASA ADS] [CrossRef] [Google Scholar]
- Pala, A. F., Gänsicke, B. T., Belloni, D., et al. 2022, MNRAS, 510, 6110 [NASA ADS] [CrossRef] [Google Scholar]
- Patterson, J., & Raymond, J. C. 1985, ApJ, 292, 550 [NASA ADS] [CrossRef] [Google Scholar]
- Patterson, J., de Miguel, E., Kemp, J., et al. 2020, ApJ, 897, 70 [NASA ADS] [CrossRef] [Google Scholar]
- Patterson, J., Enenstein, J., de Miguel, E., et al. 2022, ApJ, 940, L56 [NASA ADS] [CrossRef] [Google Scholar]
- Pekön, Y., & Balman, S. 2011, MNRAS, 411, 1177 [CrossRef] [Google Scholar]
- Rappaport, S., Joss, P. C., & Webbink, R. F. 1982, ApJ, 254, 616 [NASA ADS] [CrossRef] [Google Scholar]
- Reinsch, K., & Beuermann, K. 1990, A&A, 240, 360 [NASA ADS] [Google Scholar]
- Ritter, H. 1985, A&A, 148, 207 [NASA ADS] [Google Scholar]
- Ritter, H., & Kolb, U. 2003, A&A, 404, 301 [NASA ADS] [CrossRef] [EDP Sciences] [Google Scholar]
- Rosen, S. R., Mason, K. O., & Córdova, F. A. 1988, MNRAS, 231, 549 [NASA ADS] [CrossRef] [Google Scholar]
- Rosen, S. R., Mason, K. O., Mukai, K., et al. 1991, MNRAS, 249, 417 [CrossRef] [Google Scholar]
- Schreiber, M. R., Gänsicke, B. T., & Hessman, F. V. 2000, A&A, 358, 221 [NASA ADS] [Google Scholar]
- Schreiber, M. R., Zorotovic, M., & Wijnen, T. P. G. 2016, MNRAS, 455, L16 [NASA ADS] [CrossRef] [Google Scholar]
- Schreiber, M. R., Belloni, D., & Schwope, A. D. 2024, A&A, 682, L7 [NASA ADS] [CrossRef] [EDP Sciences] [Google Scholar]
- Seaton, M. J. 1978, MNRAS, 185, 5P [NASA ADS] [CrossRef] [Google Scholar]
- Singh, J., & Swank, J. 1993, MNRAS, 262, 1000 [NASA ADS] [CrossRef] [Google Scholar]
- Sirotkin, F. V., & Kim, W.-T. 2009, ApJ, 698, 715 [NASA ADS] [CrossRef] [Google Scholar]
- Sirotkin, F. V., & Kim, W.-T. 2010, ApJ, 721, 1356 [NASA ADS] [CrossRef] [Google Scholar]
- Suleimanov, V. F., Doroshenko, V., & Werner, K. 2019, MNRAS, 482, 3622 [NASA ADS] [CrossRef] [Google Scholar]
- Szkody, P., Nishikida, K., Erb, D., et al. 2002, AJ, 123, 413 [NASA ADS] [CrossRef] [Google Scholar]
- Townsley, D. M., & Gänsicke, B. T. 2009, ApJ, 693, 1007 [Google Scholar]
- Yuasa, T., Nakazawa, K., Makishima, K., et al. 2010, A&A, 520, A25 [NASA ADS] [CrossRef] [EDP Sciences] [Google Scholar]
All Tables
Integrated quiescent energy fluxes of the accretion-induced components (lines 1–7) and fluxes of the secondary star and WD (lines 8 and 9).
All Figures
|
Fig. 1. Quadratic term of the parabolic ephemeris of the spin maximum times of EX Hya (top). Blue: data from Mauche et al. (2009). Red and black dots: this work (Table 1, see text). Residuals from the parabolic fit (bottom). |
| In the text | |
|
Fig. 2. Frequency distribution of the yearly mean AAVSO visual magnitudes of EX Hya outside outbursts (right) and the about monthly mean Johnson V magnitudes (left), displaying the low degree of variability. |
| In the text | |
|
Fig. 3. Spin-averaged spectral energy distribution (SED) of EX Hya. Left: ultraviolet to infrared section (smoothed, black curve), spectrophotometry of Bath et al. (1981) (green dots), and our UBVRIJHK photometry (yellow dots). Also shown are the contributions of the secondary star (SEC), the intrinsic emission of the WD, and the radiatively heated polar caps (PC) (see text). Right: X-ray part of the SED. Thin black curve: spectral model absorbed as described in the text. Fat black curve: unabsorbed model. The individual measurements are referenced by numbers and letters: (1) ROSAT PSPC 0.10 − 0.28 keV (HEASARC, footnote 2), (2) Swift 0.3 − 1.0 keV (HEASARC), (3) ROSAT PSPC 0.4 − 2 keV (HEASARC), (4) Swift 1 − 2 keV (HEASARC), (5) EINSTEIN SSS 0.5 − 4.5 keV (Singh & Swank 1993), (6) XMM-Newton 0.3 − 10 keV (Pekön & Balman 2011), (7) ASCA 0.5 − 10 keV (Ishida et al. 1994a), (8) EXOSAT ME 1 − 10 keV (Rosen et al. 1988), (9) Swift 2 − 10 keV (HEASARC), (10) GINGA 2 − 10 keV (Ishida et al. 1994b), (11) GINGA 10 − 20 keV (Ishida et al. 1994b), (12) Suzaku 12 − 40 keV (Yuasa et al. 2010), and (13) NuSTAR 12 − 40 keV (Luna et al. 2018). (a) Cyan blue square: the EUV flux required to explain the observed He IIλ4686 line flux by the Zanstra method (see text). (b) Crosses: the adjusted EXOSAT LE grating spectrum (Cordova et al. 1985) with a typical error attached to a single point. |
| In the text | |
|
Fig. 4. Overall spin-averaged SED of EX Hya, displayed as log (EfE) vs log E. Black curve, labeled OBS: observed spectrum from the K-band to the Lyman edge of Fig. 3, left panel. Red curve, labeled SEC: the secondary star represented by the spectrum of Gl473AB, adjusted by a factor of 580 (BR08). Green curve, labeled WD: spectrum of the compressionally heated WD represented by a model with solar abundances and Teff = 12 000 K (see text). Blue curve, labeled PC: spectrum of the heated pole cap of the WD, represented by a WD spectrum of 25 000 K (see text). The X-ray part of the SED is taken from the right panel of Fig. 3. |
| In the text | |
|
Fig. 5. Schematic diagram of the magnetosphere and accretion region (from BR24). Viewing from the left (right) corresponds to spin minimum (maximum) Different shading of gray indicates different levels of the mass flow rate ṁ. The viewing direction for spin maximum and spin minimum are indicated for an inclination of 79° (from BR24). |
| In the text | |
Current usage metrics show cumulative count of Article Views (full-text article views including HTML views, PDF and ePub downloads, according to the available data) and Abstracts Views on Vision4Press platform.
Data correspond to usage on the plateform after 2015. The current usage metrics is available 48-96 hours after online publication and is updated daily on week days.
Initial download of the metrics may take a while.