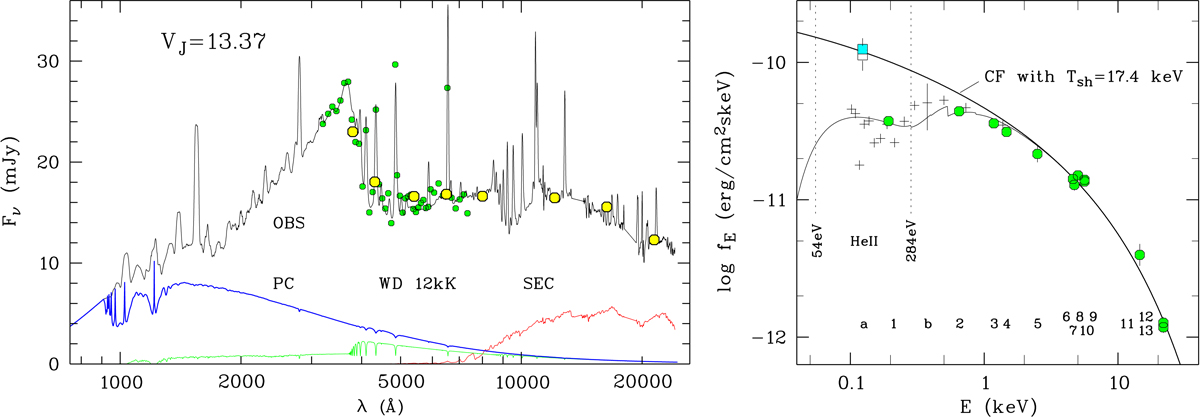
Fig. 3.
Download original image
Spin-averaged spectral energy distribution (SED) of EX Hya. Left: ultraviolet to infrared section (smoothed, black curve), spectrophotometry of Bath et al. (1981) (green dots), and our UBVRIJHK photometry (yellow dots). Also shown are the contributions of the secondary star (SEC), the intrinsic emission of the WD, and the radiatively heated polar caps (PC) (see text). Right: X-ray part of the SED. Thin black curve: spectral model absorbed as described in the text. Fat black curve: unabsorbed model. The individual measurements are referenced by numbers and letters: (1) ROSAT PSPC 0.10 − 0.28 keV (HEASARC, footnote 2), (2) Swift 0.3 − 1.0 keV (HEASARC), (3) ROSAT PSPC 0.4 − 2 keV (HEASARC), (4) Swift 1 − 2 keV (HEASARC), (5) EINSTEIN SSS 0.5 − 4.5 keV (Singh & Swank 1993), (6) XMM-Newton 0.3 − 10 keV (Pekön & Balman 2011), (7) ASCA 0.5 − 10 keV (Ishida et al. 1994a), (8) EXOSAT ME 1 − 10 keV (Rosen et al. 1988), (9) Swift 2 − 10 keV (HEASARC), (10) GINGA 2 − 10 keV (Ishida et al. 1994b), (11) GINGA 10 − 20 keV (Ishida et al. 1994b), (12) Suzaku 12 − 40 keV (Yuasa et al. 2010), and (13) NuSTAR 12 − 40 keV (Luna et al. 2018). (a) Cyan blue square: the EUV flux required to explain the observed He IIλ4686 line flux by the Zanstra method (see text). (b) Crosses: the adjusted EXOSAT LE grating spectrum (Cordova et al. 1985) with a typical error attached to a single point.
Current usage metrics show cumulative count of Article Views (full-text article views including HTML views, PDF and ePub downloads, according to the available data) and Abstracts Views on Vision4Press platform.
Data correspond to usage on the plateform after 2015. The current usage metrics is available 48-96 hours after online publication and is updated daily on week days.
Initial download of the metrics may take a while.