Fig. 4.
Download original image
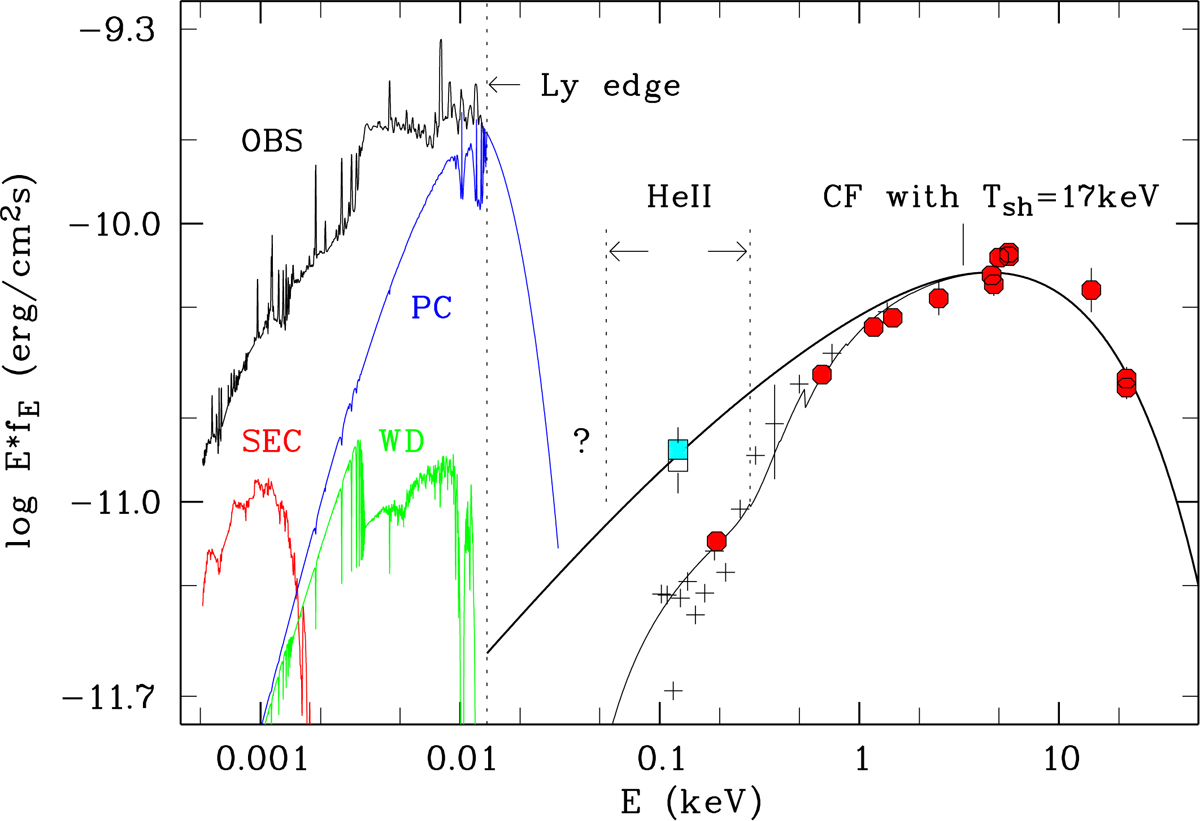
Overall spin-averaged SED of EX Hya, displayed as log (EfE) vs log E. Black curve, labeled OBS: observed spectrum from the K-band to the Lyman edge of Fig. 3, left panel. Red curve, labeled SEC: the secondary star represented by the spectrum of Gl473AB, adjusted by a factor of 580 (BR08). Green curve, labeled WD: spectrum of the compressionally heated WD represented by a model with solar abundances and Teff = 12 000 K (see text). Blue curve, labeled PC: spectrum of the heated pole cap of the WD, represented by a WD spectrum of 25 000 K (see text). The X-ray part of the SED is taken from the right panel of Fig. 3.
Current usage metrics show cumulative count of Article Views (full-text article views including HTML views, PDF and ePub downloads, according to the available data) and Abstracts Views on Vision4Press platform.
Data correspond to usage on the plateform after 2015. The current usage metrics is available 48-96 hours after online publication and is updated daily on week days.
Initial download of the metrics may take a while.