Fig. A.2
Download original image
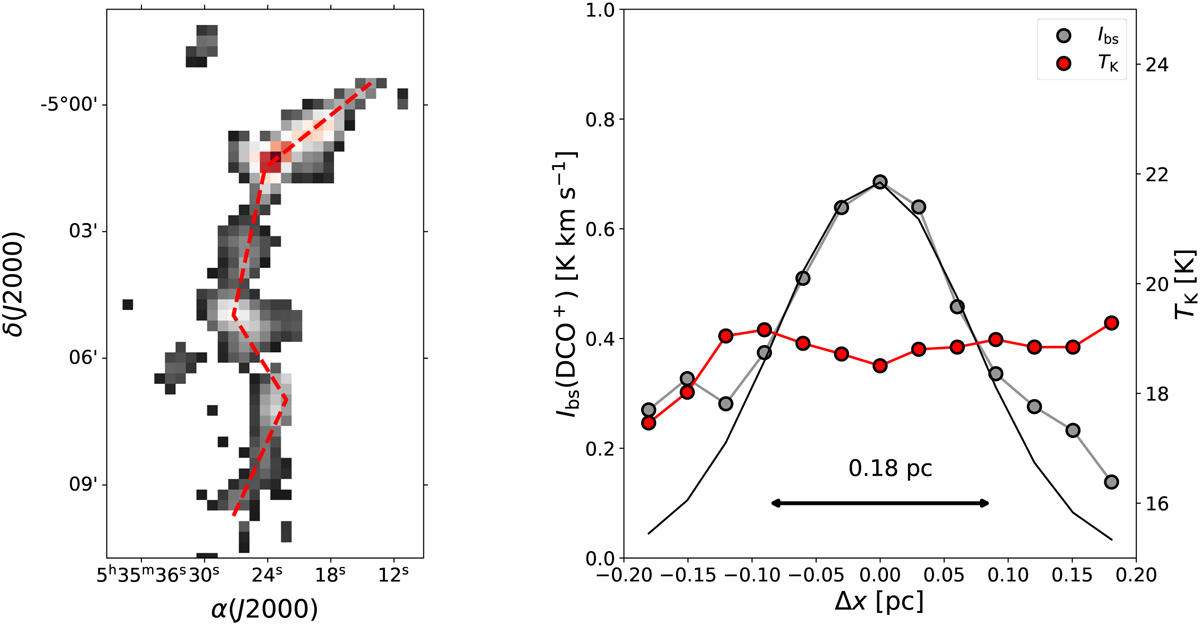
Radial profile sampling of the DCO+ integrated intensity in OMC-2 and OMC-3. Left panel: Integrated-intensity map of DCO+ (3–2) (see also Fig. 1), masked based on the criteria discussed in Sects. 3.2,4.1. The dashed red line represents the axis used for the radial sampling. Right panel: Average intensity (Ibs) and temperature (TK) radial profiles computed across the red line in the left panel. The Gaussian best fit to the profile is also displayed (solid black line), along with the derived FWHM (solid arrow).
Current usage metrics show cumulative count of Article Views (full-text article views including HTML views, PDF and ePub downloads, according to the available data) and Abstracts Views on Vision4Press platform.
Data correspond to usage on the plateform after 2015. The current usage metrics is available 48-96 hours after online publication and is updated daily on week days.
Initial download of the metrics may take a while.