Fig. A.1
Download original image
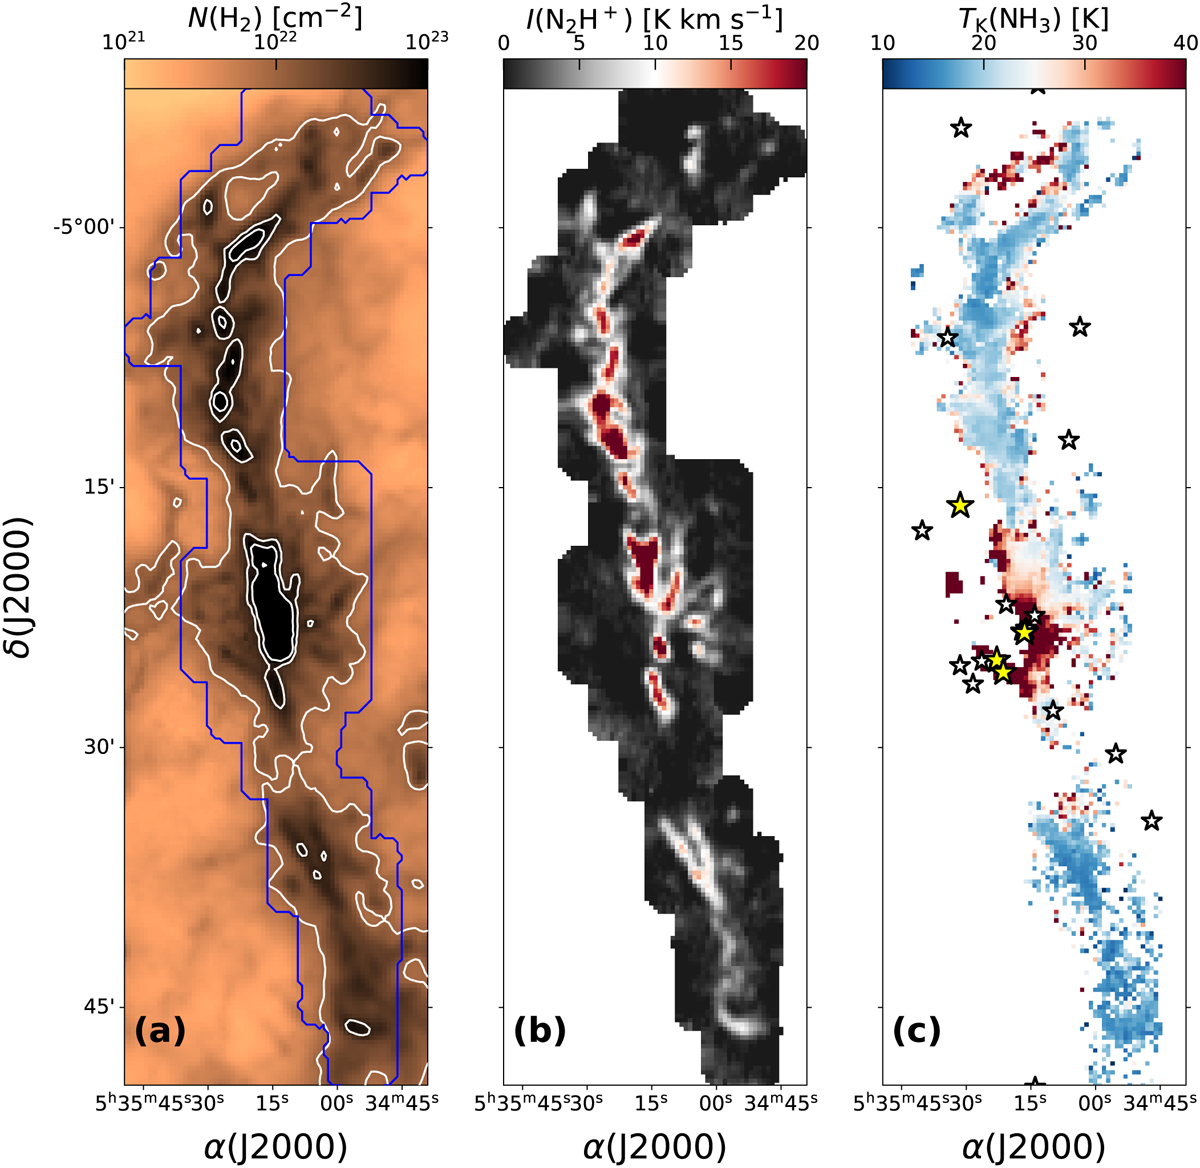
ISF as seen in different types of emission. Panel (a): Column density map of H2 (N(H2)) obtained from dust opacity Herschel+Planck observations at 850 µm (Lombardi et al. 2014). The white contours correspond to [1022, 5 × 10²², 1023] cm−2, and the blue contour represents the footprint of our IRAM-30m observations. Panel (b): N2H+ (1–0) integrated-intensity map of observed with IRAM-30m at a resolution of 30″ (see Hacar et al. 2017, for additional information). Panel (c): Kinetic temperature of the gas (TK) obtained from observations of the two inversion transitions NH3 (1,1) and NH3 (2,2) at 32″ with the GBT (Friesen et al. 2017). The white and yellow stars represent the B- and O-type stars in the region, respectively, as in Fig. 1, panel (b).
Current usage metrics show cumulative count of Article Views (full-text article views including HTML views, PDF and ePub downloads, according to the available data) and Abstracts Views on Vision4Press platform.
Data correspond to usage on the plateform after 2015. The current usage metrics is available 48-96 hours after online publication and is updated daily on week days.
Initial download of the metrics may take a while.