Fig. 5
Download original image
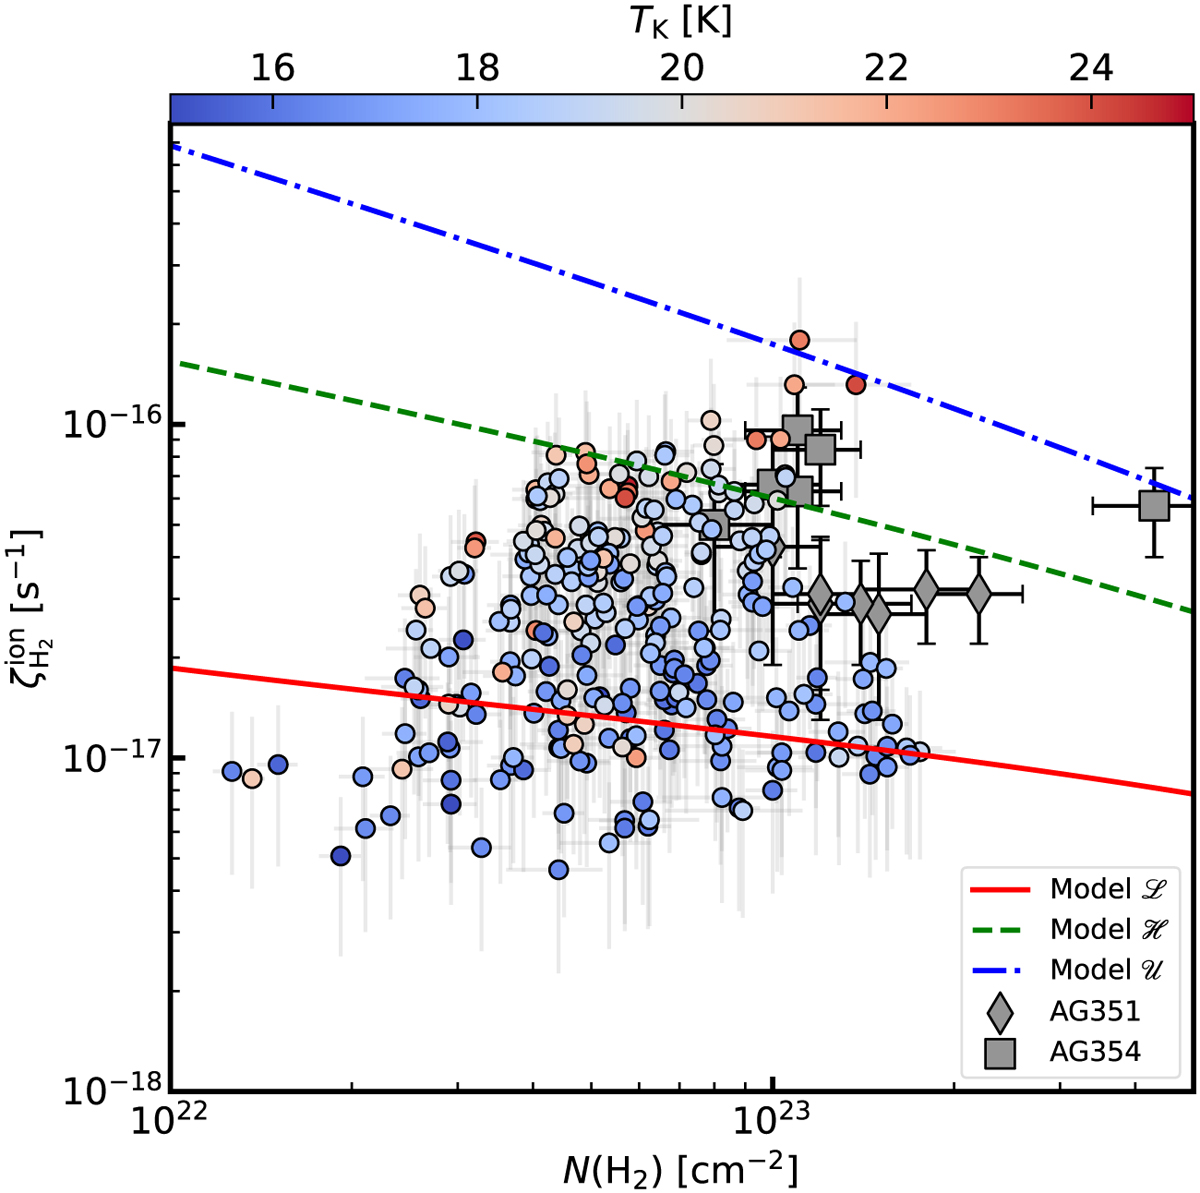
Comparison between ![]() and the column density N(H2). The theoretical predictions for the CR propagation in molecular clouds are displayed as colour-coded lines (blue, green, and red lines; Padovani et al. 2022), while the
and the column density N(H2). The theoretical predictions for the CR propagation in molecular clouds are displayed as colour-coded lines (blue, green, and red lines; Padovani et al. 2022), while the ![]() estimates in high-mass regions are displayed in grey (squares and diamonds; Sabatini et al. 2023). The estimates of
estimates in high-mass regions are displayed in grey (squares and diamonds; Sabatini et al. 2023). The estimates of ![]() from our study are displayed as circles, colour-coded by Tĸ.
from our study are displayed as circles, colour-coded by Tĸ.
Current usage metrics show cumulative count of Article Views (full-text article views including HTML views, PDF and ePub downloads, according to the available data) and Abstracts Views on Vision4Press platform.
Data correspond to usage on the plateform after 2015. The current usage metrics is available 48-96 hours after online publication and is updated daily on week days.
Initial download of the metrics may take a while.