Fig. 4
Download original image
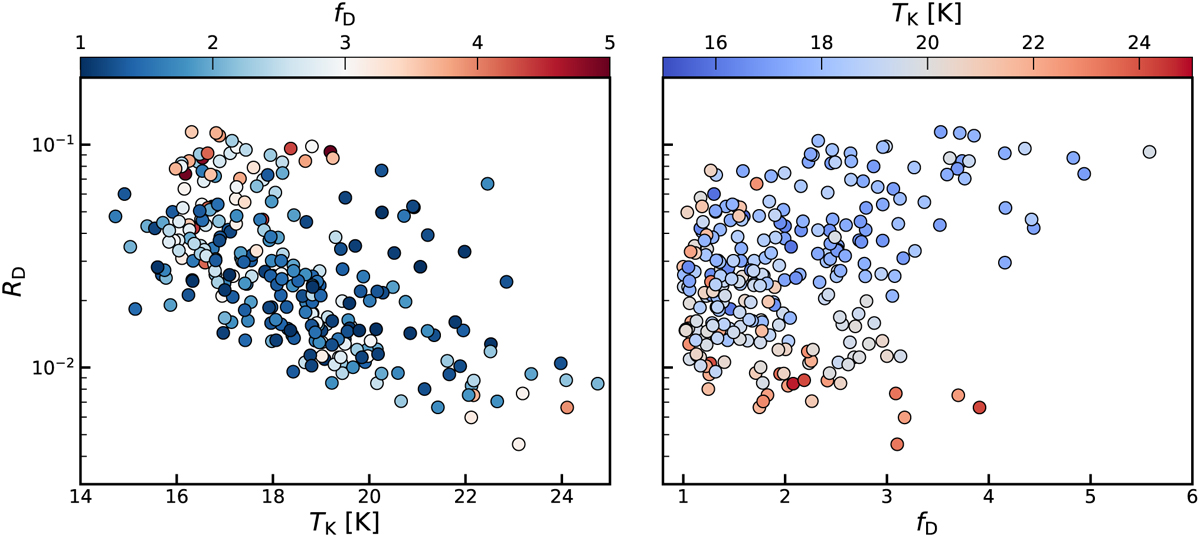
Comparison between RD, ƒD and TK in our targets. Left panel: deuteration fraction (RD) compared to the kinetic temperature (TK). Each point is colour-coded with the corresponding depletion factor (ƒD). Right panel: deuteration fraction (RD) now compared to the depletion factor (ƒD) and colour-coded with the corresponding kinetic temperature (TK).
Current usage metrics show cumulative count of Article Views (full-text article views including HTML views, PDF and ePub downloads, according to the available data) and Abstracts Views on Vision4Press platform.
Data correspond to usage on the plateform after 2015. The current usage metrics is available 48-96 hours after online publication and is updated daily on week days.
Initial download of the metrics may take a while.