Fig. 3
Download original image
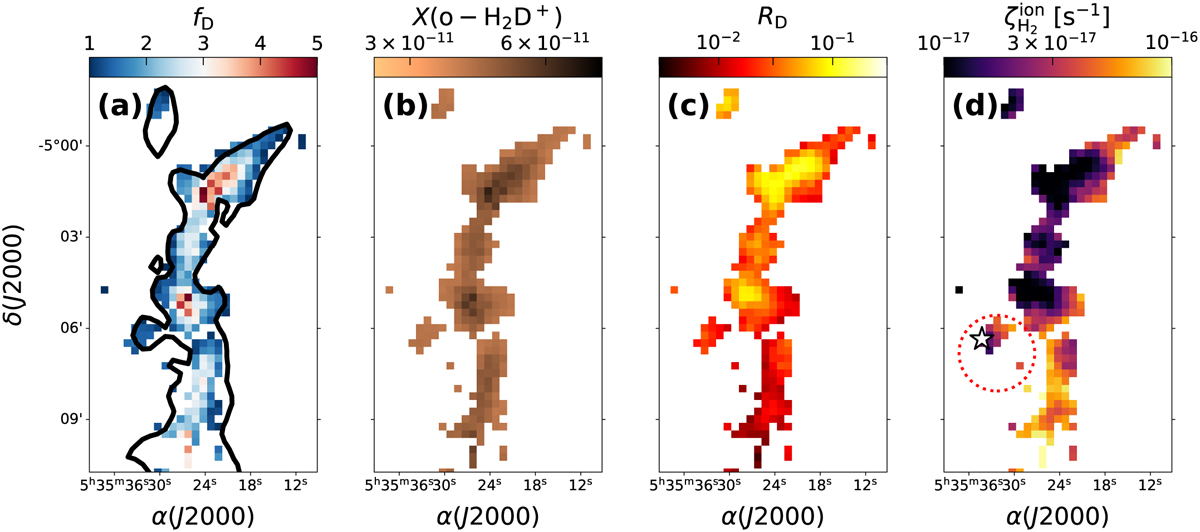
Results for OMC-2 and OMC-3. Panel a: depletion map (ƒD) obtained from the ratio of the expected abundance of C18O (X0(C18O)) in Orion and the measured abundance (Ntot(C18O)/N(H2)). The black contours represent I(N2H+) > 4 K km s−1 (signal-to-noise ratio of 10; see Fig. A.1, panel b). Panel b: abundance of o-H2D+ (X(o-H2D+)) inferred from the C18O depletion factor using the correlation from Sabatini et al. (2020). Panel c: deuteration fraction, determined as RD = N(DCO+)/N(HCO+), in OMC-2 and OMC-3 (see text for its determination). Panel d: ![]() determined with Eq. (1). The white star represents a B-type star within the selected region boundaries. The dotted red circle is a candidate expanding CO-shell (Feddersen et al. 2018) possibly connected to the star.
determined with Eq. (1). The white star represents a B-type star within the selected region boundaries. The dotted red circle is a candidate expanding CO-shell (Feddersen et al. 2018) possibly connected to the star.
Current usage metrics show cumulative count of Article Views (full-text article views including HTML views, PDF and ePub downloads, according to the available data) and Abstracts Views on Vision4Press platform.
Data correspond to usage on the plateform after 2015. The current usage metrics is available 48-96 hours after online publication and is updated daily on week days.
Initial download of the metrics may take a while.