Fig. 1
Download original image
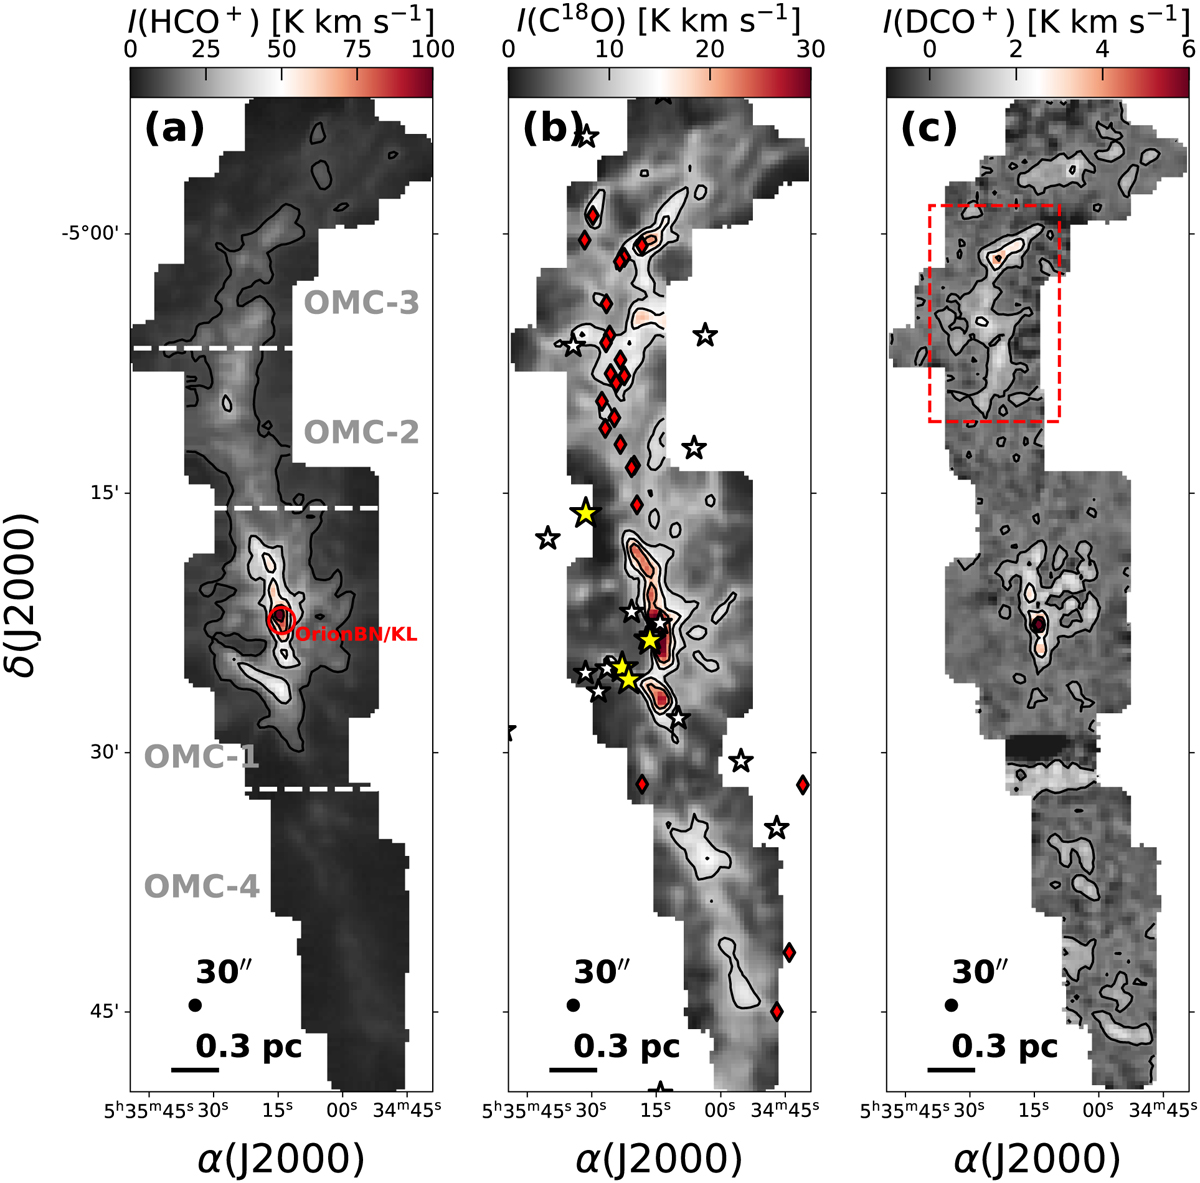
Integral shaped filament as seen through our suite of tracers. Panel a: HCO+ (1–0) integrated-intensity map of the four OMCs composing the ISF (separated by white lines; Bally 2008). The contours correspond to [10, 30, 50, 70, 90] K km s−1. The red circle represents the position of the Orion BN/KL object. Panel b: C18O (2–1) integrated-intensity map of the OMCs composing the ISF. We include the O-type (yellow stars) and B-type (white stars) stars in the region, gathered from the SIMBAD Astronomical Database (Wenger et al. 2000), and the outflows detected by Tanabe et al. (2019) (red diamonds; see text for full discussion). The contours correspond to [10, 15, 20] K km s−1. Panel c: DCO+ (3–2) integrated-intensity map of the OMCs composing the ISF. The contours correspond to [0.5, 2, 4, 6] K km s−1, where the lowest contour corresponds to a signal-to-noise ratio of 3. The red box is the region selected for the analysis, comprising part of OMC-2 and the whole OMC-3 (see text for a discussion).
Current usage metrics show cumulative count of Article Views (full-text article views including HTML views, PDF and ePub downloads, according to the available data) and Abstracts Views on Vision4Press platform.
Data correspond to usage on the plateform after 2015. The current usage metrics is available 48-96 hours after online publication and is updated daily on week days.
Initial download of the metrics may take a while.