Fig. 5
Download original image
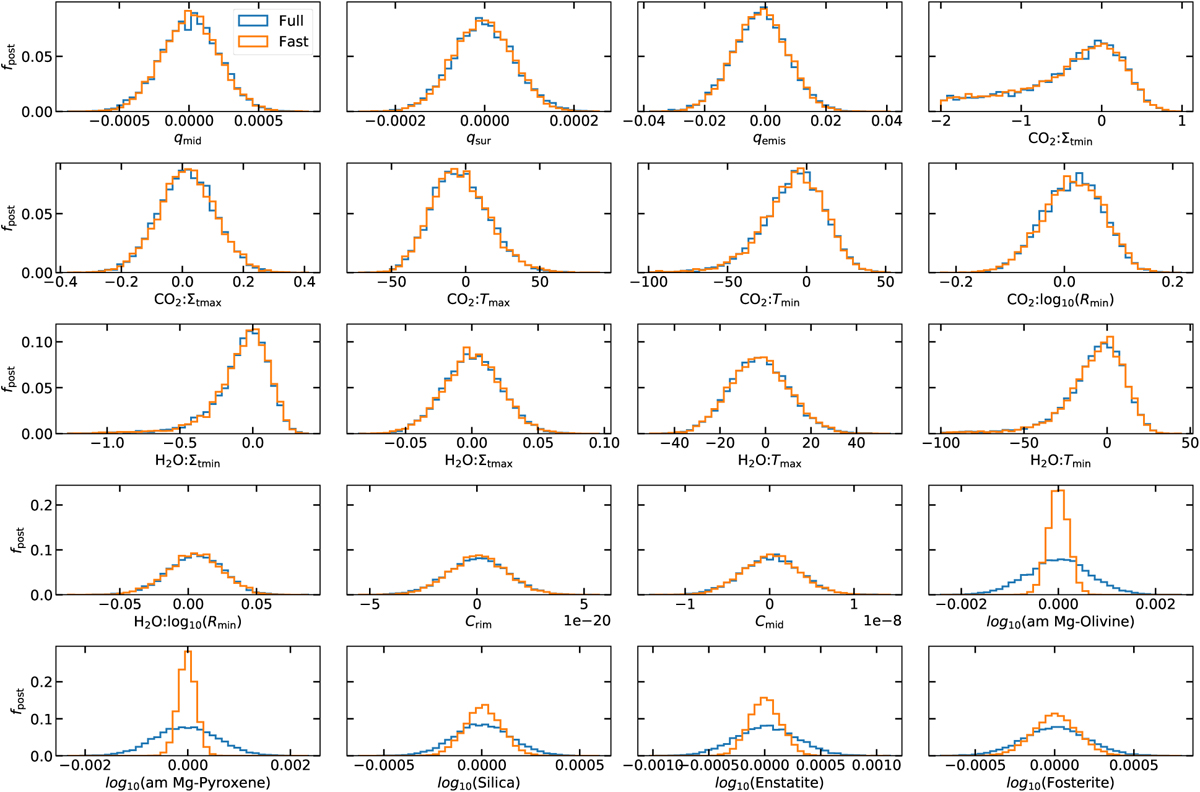
Histograms of the posterior of all parameters for fits of the mock observations. The results obtained by fitting all parameters with MultiNest (full) are shown with blue lines. The results obtained with the accelerated method (fast) are shown with orange lines. The horizontal axis shows the parameter differences to the values used to create the mock observation. The vertical axis displays the fraction (fpost) of posterior models in the displayed bins.
Current usage metrics show cumulative count of Article Views (full-text article views including HTML views, PDF and ePub downloads, according to the available data) and Abstracts Views on Vision4Press platform.
Data correspond to usage on the plateform after 2015. The current usage metrics is available 48-96 hours after online publication and is updated daily on week days.
Initial download of the metrics may take a while.