Open Access
Fig. 2
Download original image
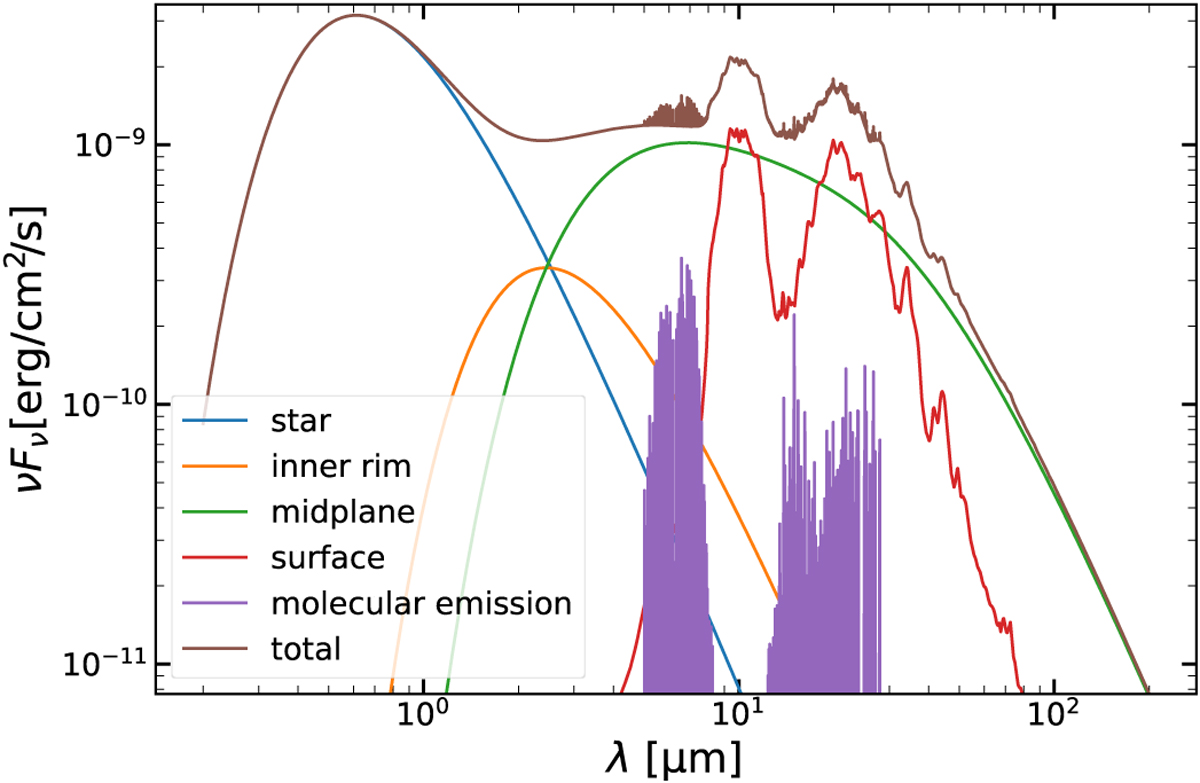
Example model. The brown line shows the total flux of the model. This flux is a combination of stellar flux (blue), rim flux; (orange), midplane flux (green), surface flux (red), and molecular emis-sion (purple).
Current usage metrics show cumulative count of Article Views (full-text article views including HTML views, PDF and ePub downloads, according to the available data) and Abstracts Views on Vision4Press platform.
Data correspond to usage on the plateform after 2015. The current usage metrics is available 48-96 hours after online publication and is updated daily on week days.
Initial download of the metrics may take a while.