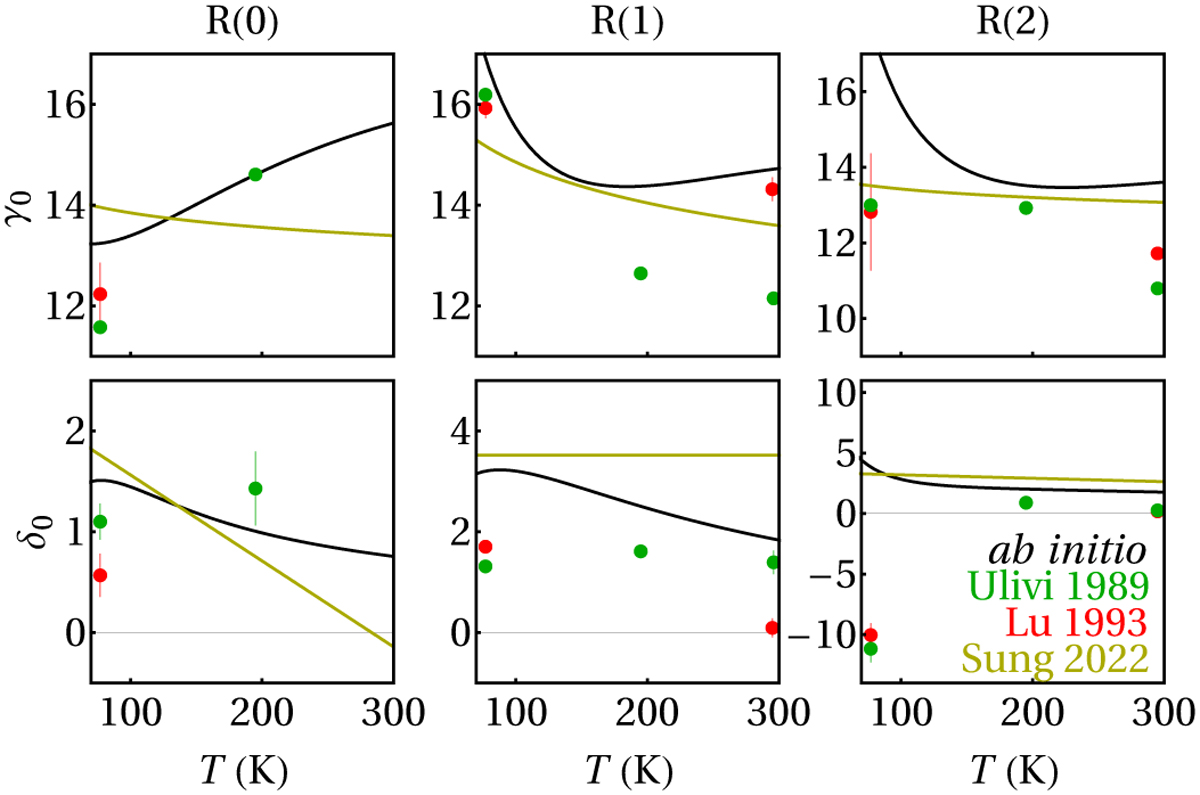
Fig. 4
Download original image
Comparison of the experimental and theoretical values of the pressure broadening and shift parameters, γ0 and δ0 (in units of 10−3 cm−1 atm−1 ). Black curves correspond to the ab initio calculations performed in this work, while green and red points report the experimental measurements from Ulivi et al. (1989) and Lu et al. (1993), respectively. The olive curves are the single-power-law (for γ0) and linear (for δ0) temperature dependences retrieved from the measurements of Sung et al. (2022).
Current usage metrics show cumulative count of Article Views (full-text article views including HTML views, PDF and ePub downloads, according to the available data) and Abstracts Views on Vision4Press platform.
Data correspond to usage on the plateform after 2015. The current usage metrics is available 48-96 hours after online publication and is updated daily on week days.
Initial download of the metrics may take a while.