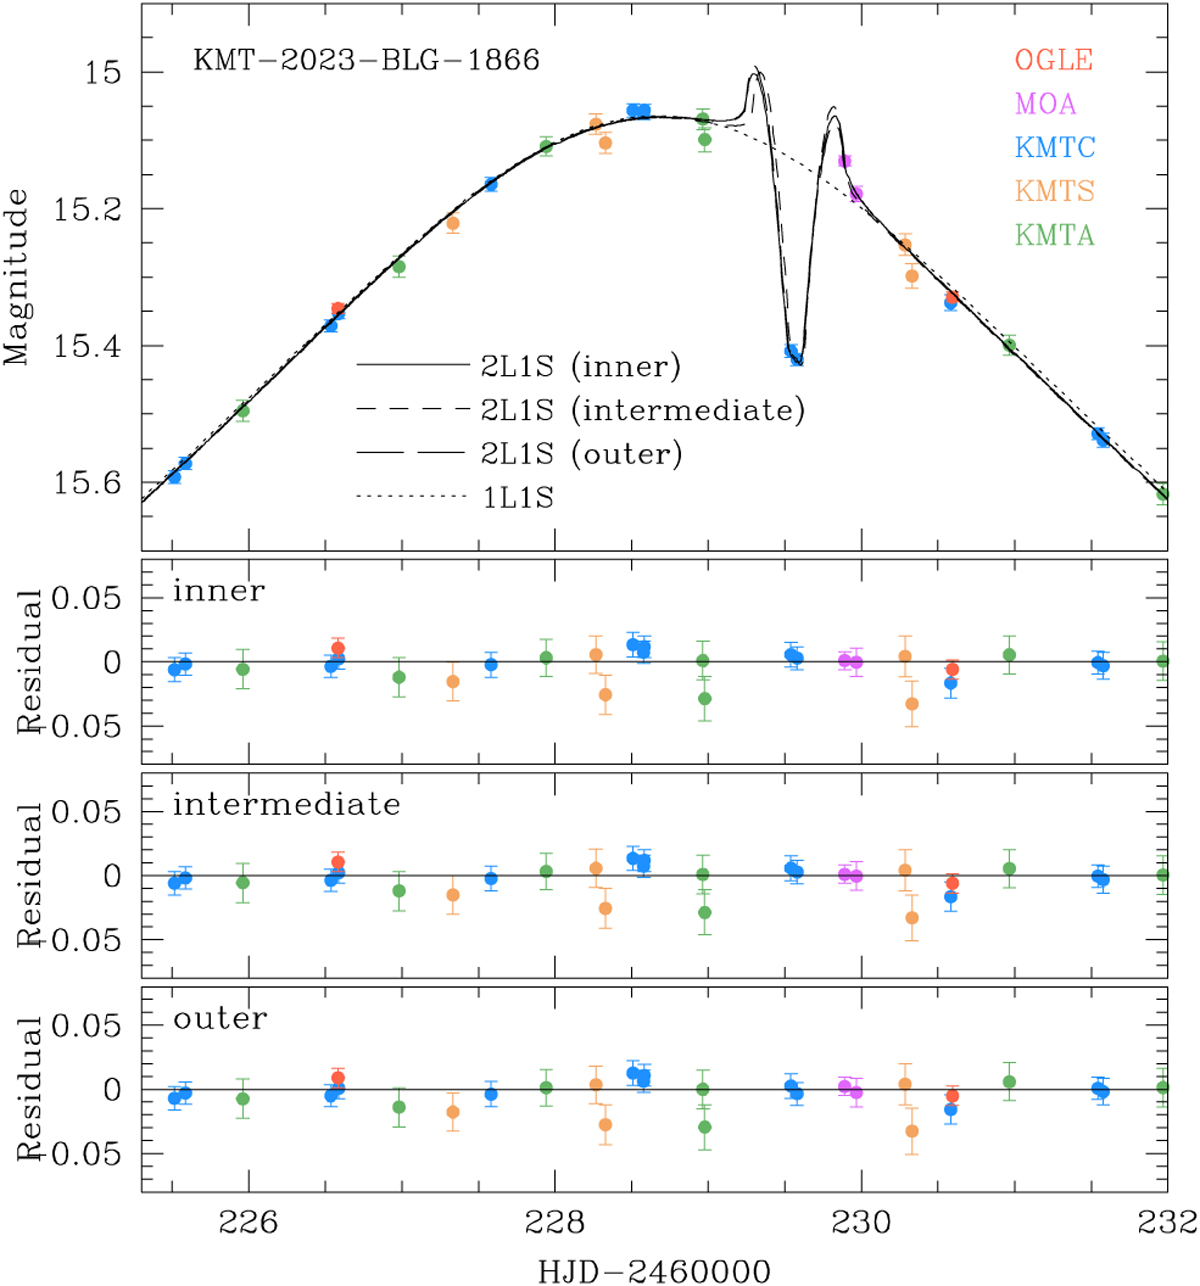
Fig. 3
Download original image
Comparison of model curves of three identified local solutions (“inner”, “intermediate”, and “outer”) in the region of the anomaly. The model curves of the solutions are drawn over the data points in different line types. The lower three panels show the residuals from the individual solutions. The lensing parameters of the individual solutions are listed in Table 2, and the corresponding lens-system configurations are presented in Fig. 4.
Current usage metrics show cumulative count of Article Views (full-text article views including HTML views, PDF and ePub downloads, according to the available data) and Abstracts Views on Vision4Press platform.
Data correspond to usage on the plateform after 2015. The current usage metrics is available 48-96 hours after online publication and is updated daily on week days.
Initial download of the metrics may take a while.