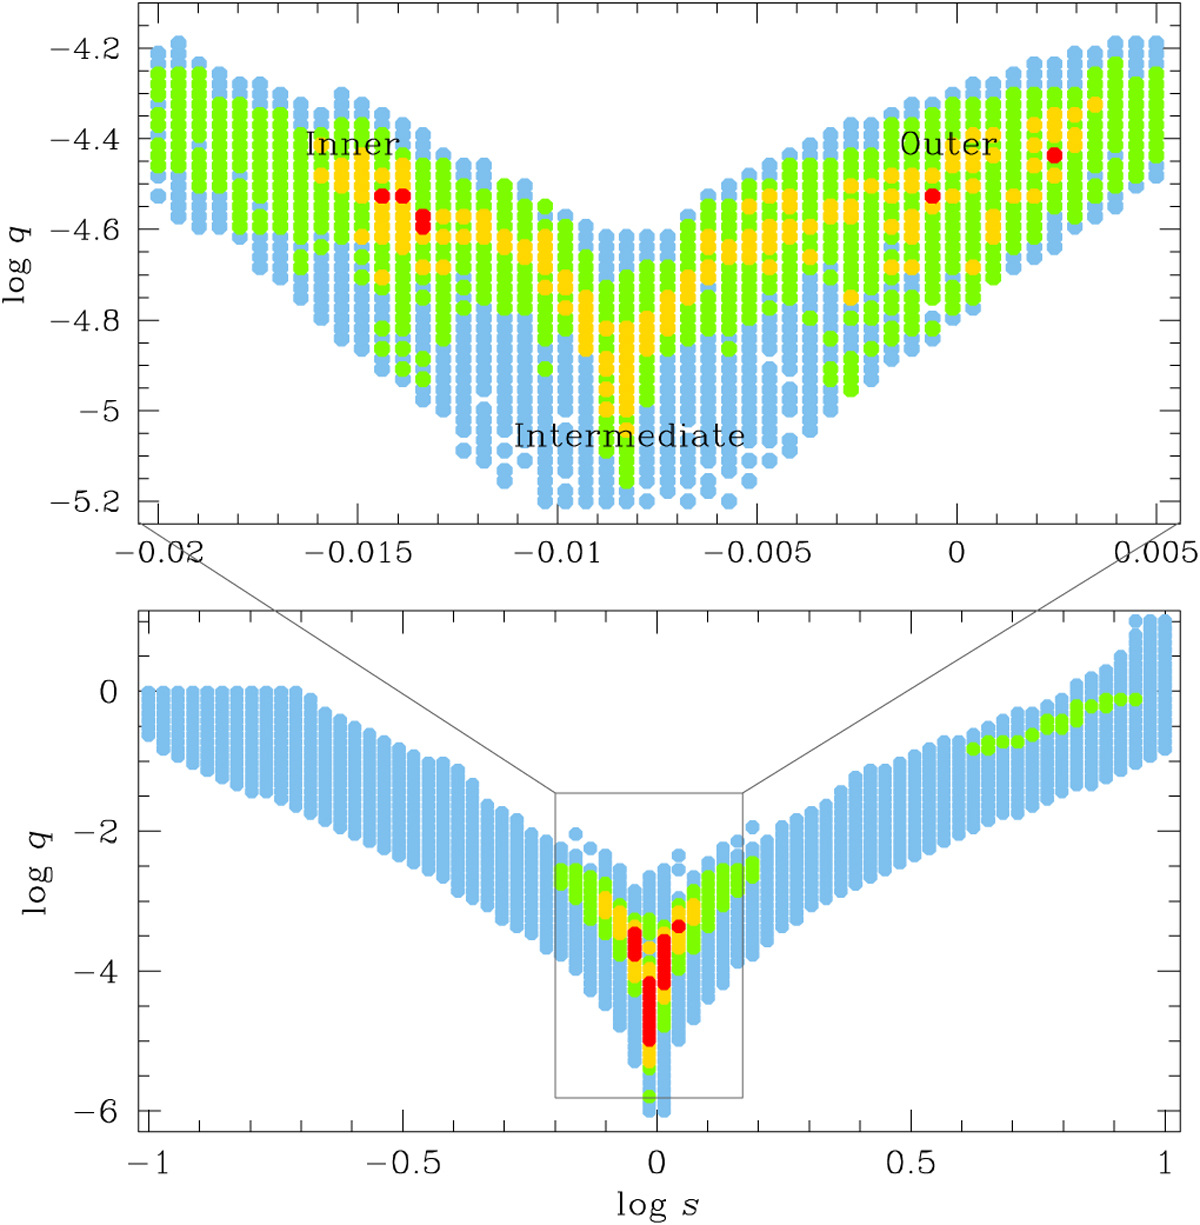
Fig. 2
Download original image
Δχ2 map of (log s, log q) parameter plane obtained from the grid search. In the lower panel, the entire grid of the inspected region is displayed, while the upper panel provides a closer look at the area surrounding the three local solutions. Three identified local solutions are labeled as “inner”, “intermediate”, and “outer”. The color scheme is configured to represent points as red (<1n), yellow (<4n), green (<9n), and cyan (<16n). Here, n = 1 for the upper map and n = 10 for the lower map.
Current usage metrics show cumulative count of Article Views (full-text article views including HTML views, PDF and ePub downloads, according to the available data) and Abstracts Views on Vision4Press platform.
Data correspond to usage on the plateform after 2015. The current usage metrics is available 48-96 hours after online publication and is updated daily on week days.
Initial download of the metrics may take a while.