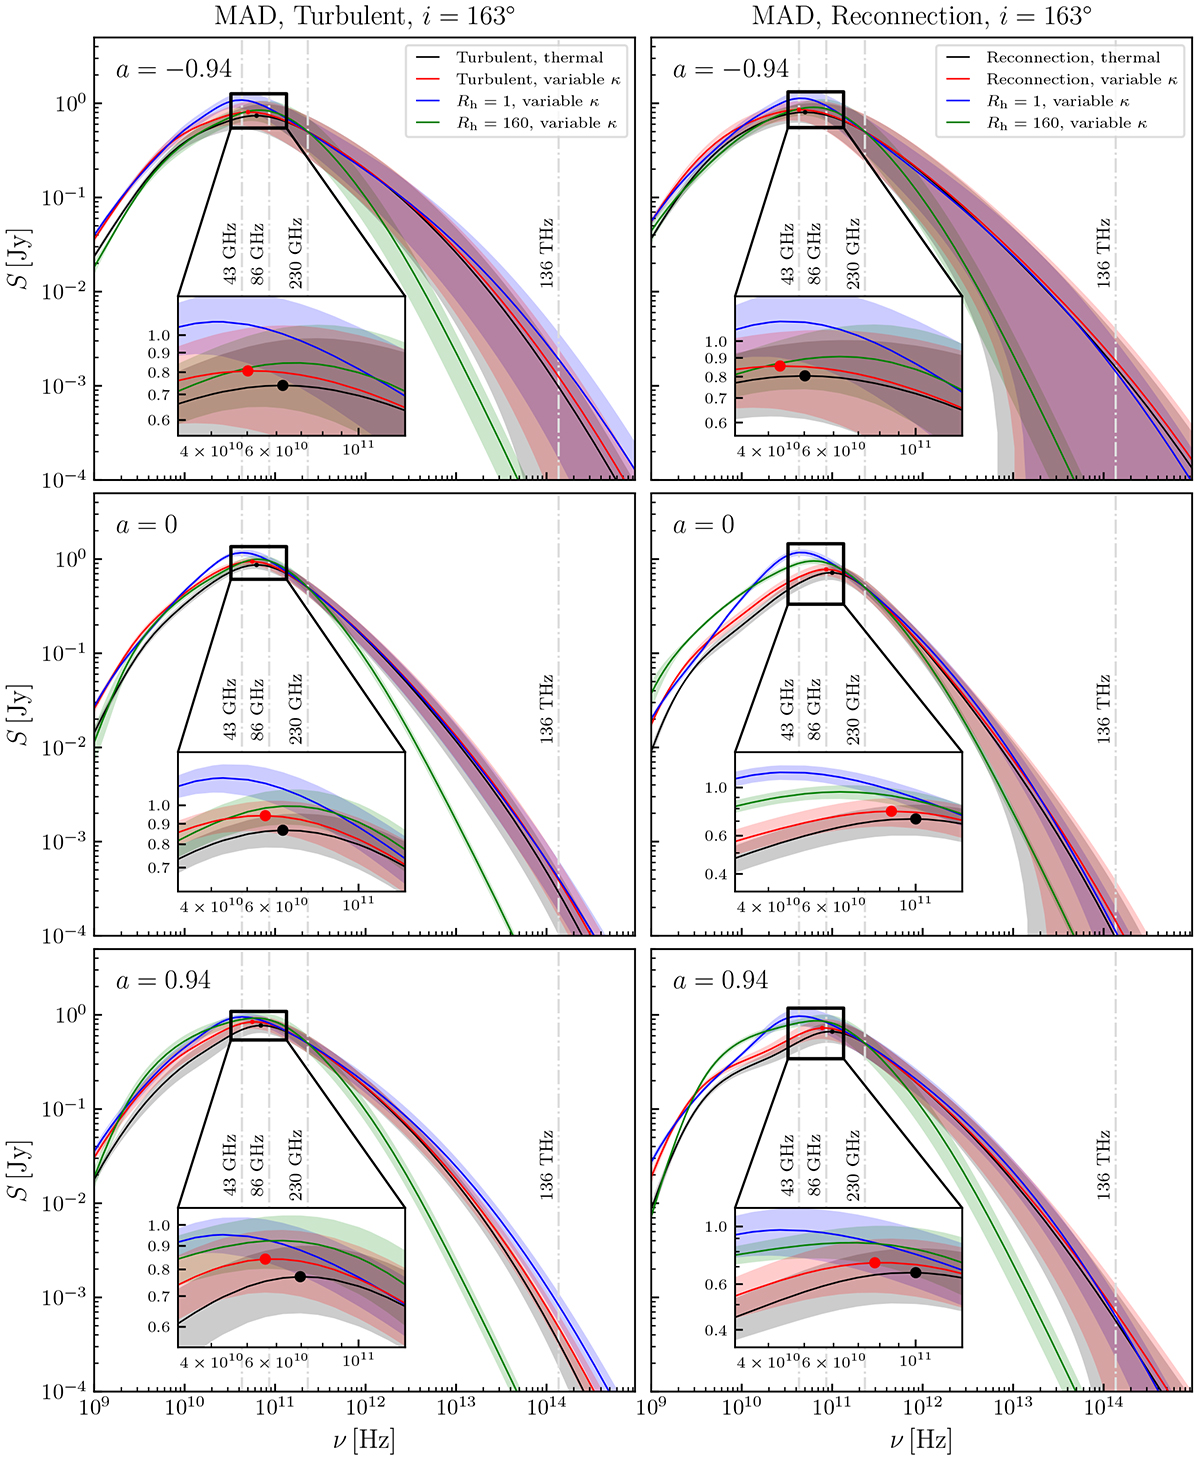
Fig. 7.
Download original image
Spectral energy distribution curves with different eDFs and different spins in turbulent heating (left) and reconnection heating (right) models. From top to bottom: black hole spins are −0.9375, 0, and 0.9375, respectively. The black curves adopt the thermal eDF, while the red curves employ variable κ eDF. For the comparison, variable κ eDF using the R − β model with Rh = 1 and 160 are presented as blue and green curves, respectively. The solid curves represent average values and the shaded regions denote the standard deviation relative to the average values. The dash-dotted vertical lines correspond to 43 GHz, 86 GHz, 230 GHz, and 136 THz.
Current usage metrics show cumulative count of Article Views (full-text article views including HTML views, PDF and ePub downloads, according to the available data) and Abstracts Views on Vision4Press platform.
Data correspond to usage on the plateform after 2015. The current usage metrics is available 48-96 hours after online publication and is updated daily on week days.
Initial download of the metrics may take a while.