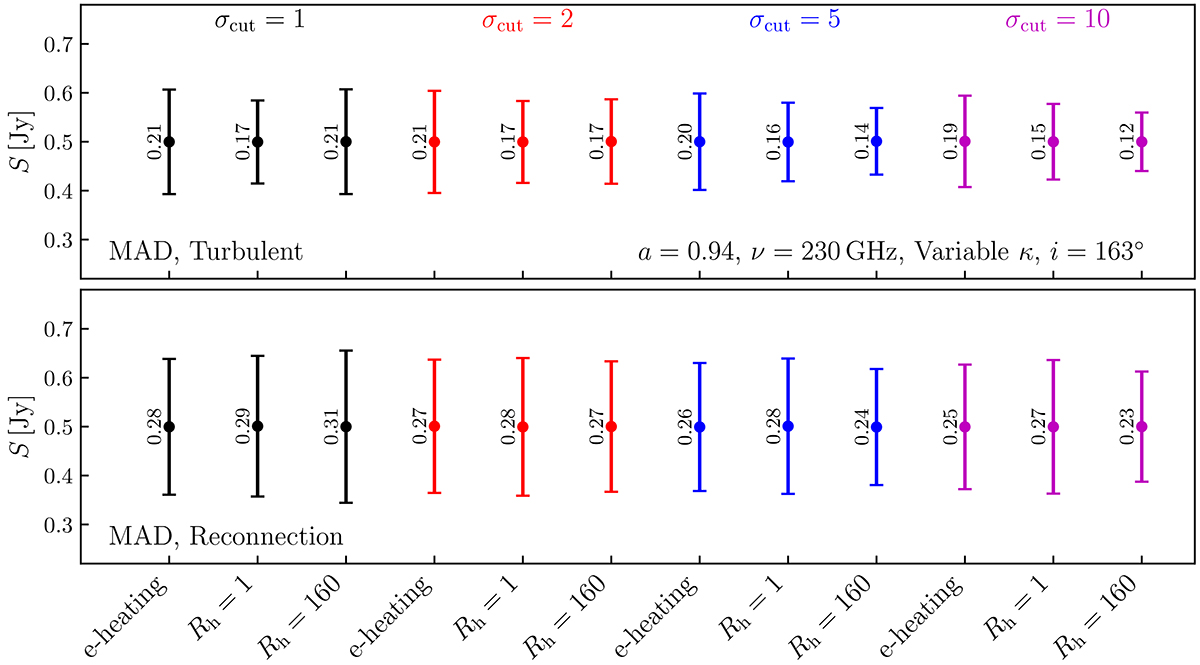
Fig. 12.
Download original image
Total flux variation of corotating cases in the turbulent heating model (top) and reconnection model (bottom) at 230 GHz. The different colors correspond to the different exclusions of magnetized regions: σcut = 1 (black), 2 (red), 5 (blue), and 10 (magenta). The labels at the bottom denote the different heating prescriptions: the electron heating model (e-heating), the R − β model with Rh = 1 (Rh = 1), and the R − β model with Rh = 160 (Rh = 160). The colored dots represent average values from time variation in the specific models and the error bars denote the standard deviation relative to the average values (the number beside each error bar indicates the value of standard deviation normalized by the averaged value).
Current usage metrics show cumulative count of Article Views (full-text article views including HTML views, PDF and ePub downloads, according to the available data) and Abstracts Views on Vision4Press platform.
Data correspond to usage on the plateform after 2015. The current usage metrics is available 48-96 hours after online publication and is updated daily on week days.
Initial download of the metrics may take a while.