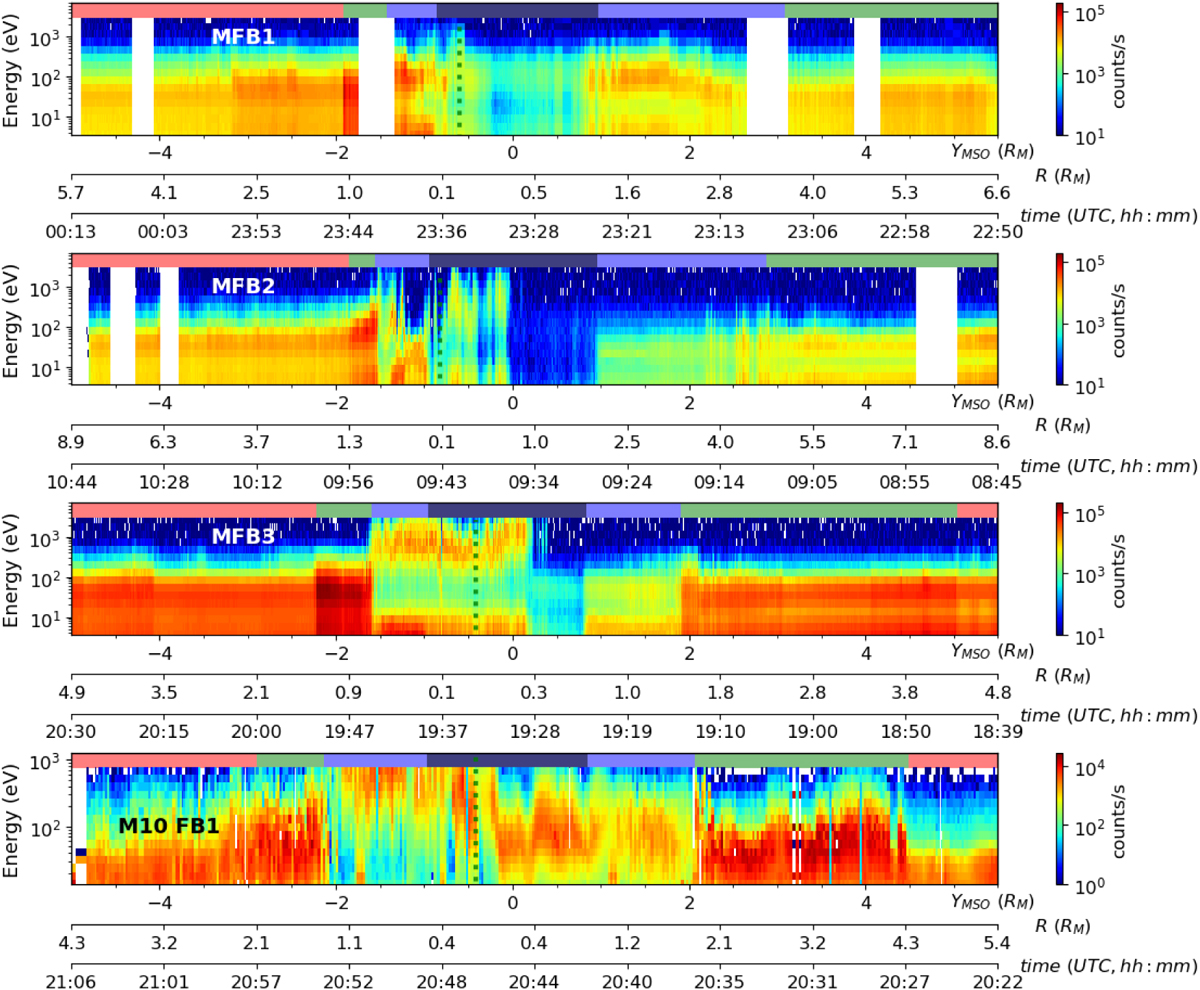
Fig. 2

Download original image
Energy-distance spectrograms of electron count rates displayed as a function of the distance along the YMSO axis. From top to bottom: MEA1 observations for MFB1, MFB2, and MFB3, and SES observations for M10 FB1. The vertical dashed green line delineates the CA. For each flyby, the spacecraft altitude (in Mercury radius) and the time (in UTC, HH:MM) are indicated below the corresponding plot. We note that the time increases from right to left. The red, green, and light and dark blue boxes above the corresponding plot delineate the SW, the magnetosheath, the magnetosphere, and the eclipse (or shadow regions) crossed by the spacecraft for each flyby, respectively.
Current usage metrics show cumulative count of Article Views (full-text article views including HTML views, PDF and ePub downloads, according to the available data) and Abstracts Views on Vision4Press platform.
Data correspond to usage on the plateform after 2015. The current usage metrics is available 48-96 hours after online publication and is updated daily on week days.
Initial download of the metrics may take a while.


