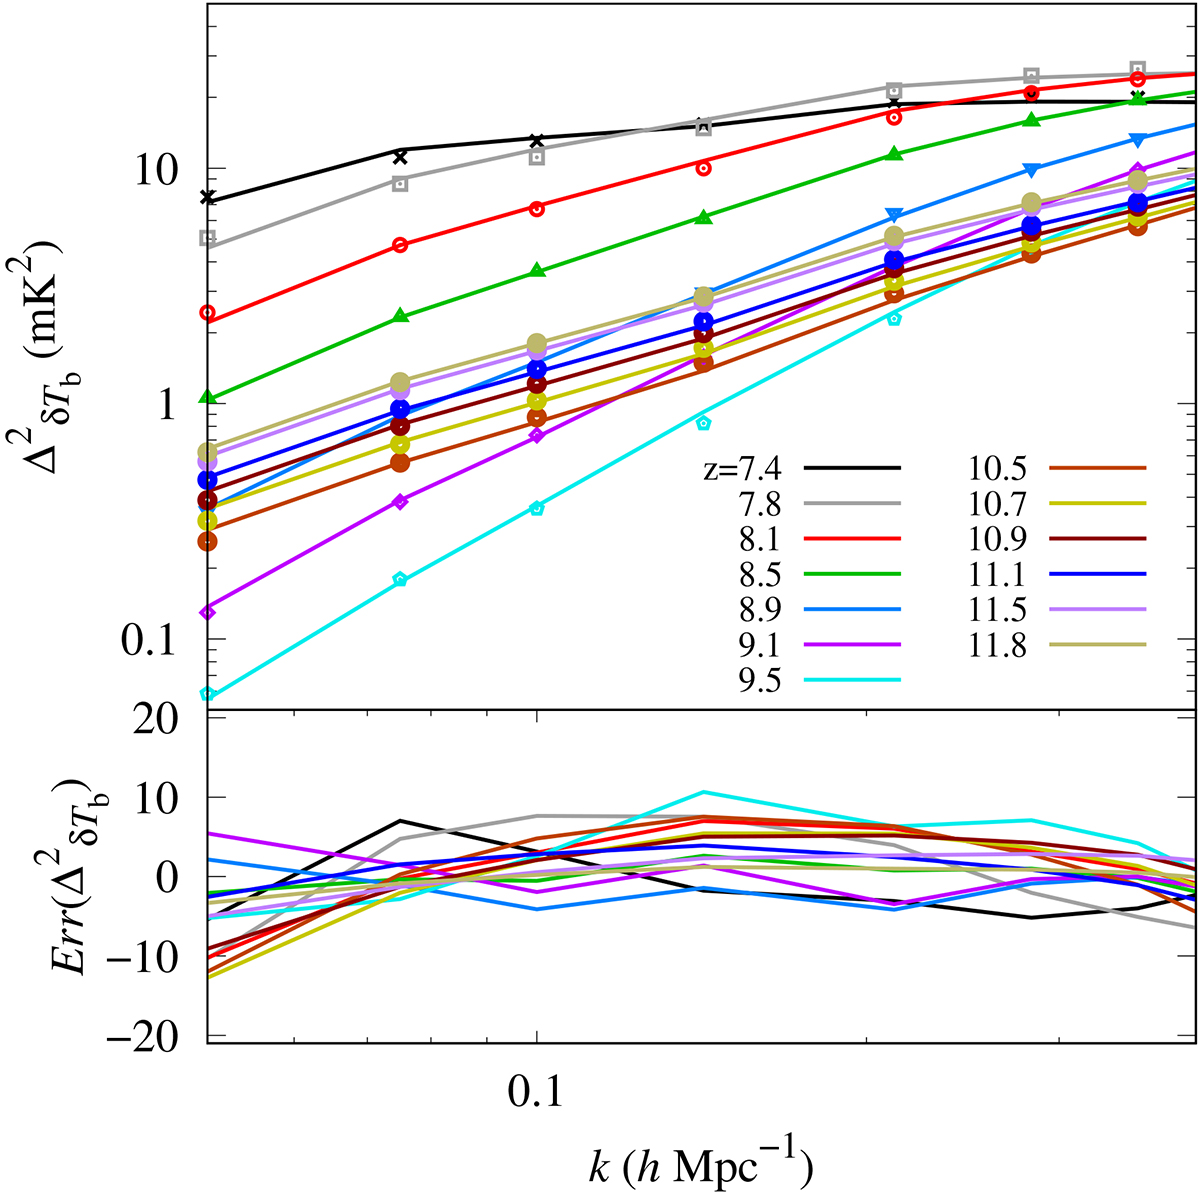
Fig. 6.
Download original image
Comparing simulated and fitted EoR power spectra using Eq. (3). The top panel shows a comparison between the 21 cm signal power spectrum of our fiducial reionization scenario and its best-fit power spectrum obtained using Eq. (3). Different colors represent different redshifts. The lines correspond to the power spectrum ![]() from GRIZZLY simulations while the points stand for the fitted power spectrum
from GRIZZLY simulations while the points stand for the fitted power spectrum ![]() . The bottom panel shows the percentage fitting error Err
. The bottom panel shows the percentage fitting error Err .
.
Current usage metrics show cumulative count of Article Views (full-text article views including HTML views, PDF and ePub downloads, according to the available data) and Abstracts Views on Vision4Press platform.
Data correspond to usage on the plateform after 2015. The current usage metrics is available 48-96 hours after online publication and is updated daily on week days.
Initial download of the metrics may take a while.