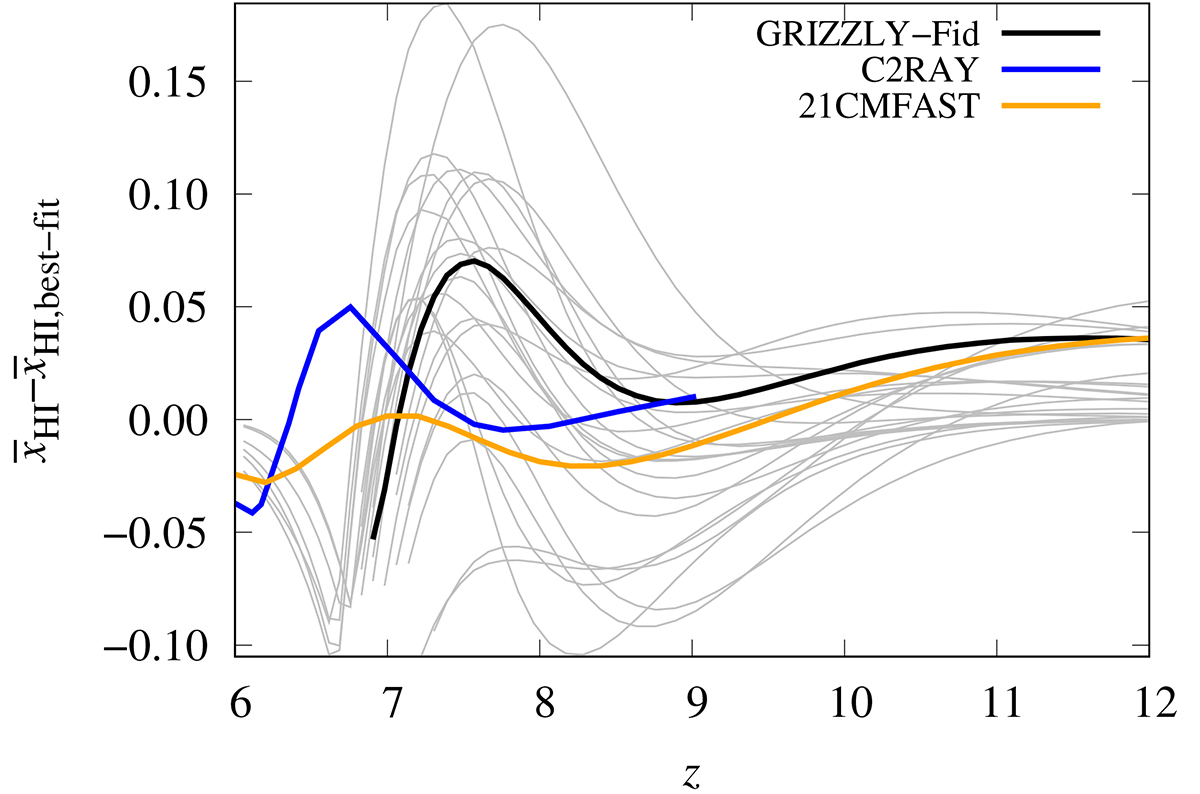
Fig. 13.
Download original image
Redshift evolution of the difference between the input model neutral fraction and best-fit neutral fraction. The MCMC analysis here considers our eight-parameter model for the EoR power spectra. Different thin grey curves stand for different reionization scenarios from GRIZZLY simulation. The black curve represents our fiducial GRIZZLY simulation while the blue and orange curves present C2RAY and 21CMFAST input scenarios. The best-fit parameter values are obtained using input power spectra at eight redshifts for each reionization scenario.
Current usage metrics show cumulative count of Article Views (full-text article views including HTML views, PDF and ePub downloads, according to the available data) and Abstracts Views on Vision4Press platform.
Data correspond to usage on the plateform after 2015. The current usage metrics is available 48-96 hours after online publication and is updated daily on week days.
Initial download of the metrics may take a while.