| Issue |
A&A
Volume 687, July 2024
|
|
|---|---|---|
| Article Number | A34 | |
| Number of page(s) | 13 | |
| Section | Stellar atmospheres | |
| DOI | https://doi.org/10.1051/0004-6361/202348975 | |
| Published online | 27 June 2024 | |
A comprehensive X-ray analysis of the massive O-type binary HD 93250 over two decades
1
Space Sciences, Technologies and Astrophysics Research (STAR) Institute, University of Liège,
Quartier Agora, B5c, 6 Août, 19c,
4000
Sart Tilman, Belgium
e-mail: This email address is being protected from spambots. You need JavaScript enabled to view it.
2
Aryabhatta Research Institute of Observational Sciences (ARIES),
Nainital –
263 001, India
Received:
15
December
2023
Accepted:
26
March
2024
Abstract
Context. Massive star winds are known to be responsible for X-ray emission arising from wind plasma heated by the strong shocks up to temperatures of 106–107 K in the case of colliding wind binaries. The investigation of X-ray emission from massive stars thus constitutes a valuable tool for identifying binaries, which is otherwise a difficult task using classical techniques.
Aims. We investigated thermal and nonthermal X-ray emission from the massive O-type star HD 93250 to unveil its binary orbital parameters independently.
Methods. To meet our goal, we analyzed X-ray data obtained with European Photon Imaging Camera on board XMM-Newton spanning over ~19 yr. Additionally, we analyzed NuSTAR observations of HD 93250 taken at various epochs.
Results. We determine the variability timescale of the X-ray emission to be 193.8±1.3d, in full agreement with the 194.3±0.4d period derived from the astrometric orbit. The X-ray spectrum of HD 93250 is well explained by a three-temperature thermal plasma emission model with temperatures of 0.26, 1.0, and 3.3 keV. The resulting X-ray flux varies in compliance with the typical colliding wind emission from eccentric massive binaries where it enhances near periastron passage and decreases gradually close to apastron in proportion to the inverse of the binary separation. The periastron-to-apastron X-ray emission ratio points to an eccentricity range of 0.20–0.25, once again in agreement with the previously determined astrometric orbit. Finally, we do not detect any hard X-ray emission attributable to nonthermal emission above 10 keV.
Conclusions. Given the derived plasma temperature, the strong phase-locked variability, and the significant over-luminosity in X-rays, we establish that the X-ray emission from HD 93250 is dominated by the colliding-wind region. Our results lend support to the idea that X-ray time analysis of massive stars constitutes a relevant tool for investigating their multiplicity and for extracting relevant information on their basic orbital parameters – such as period and eccentricity – independently of any orbital solution derived from classical techniques.
Key words: binaries: general / stars: early-type / stars: massive / stars: individual: HD 93250 / stars: winds, outflows
© The Authors 2024
 Open Access article, published by EDP Sciences, under the terms of the Creative Commons Attribution License (https://creativecommons.org/licenses/by/4.0), which permits unrestricted use, distribution, and reproduction in any medium, provided the original work is properly cited.
This article is published in open access under the Subscribe to Open model. This email address is being protected from spambots. You need JavaScript enabled to view it. to support open access publication.
1 Introduction
The Carina nebula region is an interesting star-forming region of the galaxy containing some of the youngest and most massive O-type stars. HD 93250 is an O-type member of the open cluster Trumpler 16, which was first seen in X-rays with the high-resolution imager (HRI) and imaging proportional counter (IPC) on board the Einstein observator in 1978 (Seward et al. 1979).
The star has been classified as spectral type O3 V((f)) (Walborn 1971, 1972). Walborn et al. (2002) revised the spectral type of HD 93250 to O3.5 V((f+)) and later to O4 III(fc) in Walborn et al. (2010) after looking at its C III emission lines. It was again reclassified as O4 IV(fc) as it is similar to the other class IV object as observed by Maíz Apellániz et al. (2016). Evans et al. (2003) discussed the probable binarity of the source from its strong and hard X-ray emission. Similarly, Antokhin et al. (2008) studied five observation IDs from XMM-Newton spanning over a year and explained the X-ray spectra of HD 93250 with multiple components of the optically thin thermal plasma model. Several spectroscopic and radial velocity measurements performed over a few decades have missed any clear evidence for the binary nature of the source (Thackeray et al. 1973; Walborn 1982; Gies 1987; Penny 1996; Rauw et al. 2009; Williams et al. 2011). However, Gagné et al. (2011) suggested that HD 93250 could be either an O+O binary with a period of > 30 days or a magnetic star based on its enhanced and variable X-ray emission as seen in Chandra observations. In parallel, Sana et al. (2011) announced an interferometric detection of a similar binary companion at a separation of ~ 1.5 mas, corresponding to 3.5 AU at the distance of Carina using the ESO Very Large Telescope Interferometer (VLTI) observation made with the Astronomical Multi-BEam combineR (AMBER) instrument on 2010 December 27. Later, Le Bouquin et al. (2017) constrained the astrometric orbit of HD 93250 and derived a binary orbital period of 194.31 ±0.39 days, with an eccentricity of 0.217±0.011. These authors used data provided by Sana et al. (2011) in addition to more interferometric observations obtained by AMBER and the Precision Integrated-Optics Near-infrared Imaging ExpeRiment (PIONIER) instrument of VLTI for HD 93250. The findings of the latter study suggested that the system consists of similar high-mass O4 type components. A low angle of inclination and the similarity in mass of the binary components have been suggested to cause the nondetection of variations in its radial velocity during past investigations.
The aim of our detailed study of HD 92350 is to characterize the variations in its X-ray emission according to the binary parameters reported by Le Bouquin et al. (2017) and Sana et al. (2011). Colliding winds have been speculated to significantly contribute to the X-ray emission from HD 93250 presented in the above-mentioned studies. In light of the clarification of the orbital properties of the system, it is now timely to reconsider the question of the X-ray emission from HD 93250. To this end, we investigated X-ray observations of HD 93250 over a time baseline of unprecedented duration for this object.
This paper is organized as follows. Section 1 describes the target and summarizes the outcome of previous works relevant to our purpose. Section 2 presents the X-ray observations and the processing of data used for the present study. The X-ray light curve and spectral analysis are detailed in Sects. 3 and 4, respectively. Finally, Sect. 5 includes a discussion of our main results, while conclusions are drawn in Sect. 6.
2 Observations and data reduction
2.1 X-ray monitoring of HD 93250 with XMM-Newton
We analyzed X-ray data of HD 93250 obtained with XMM–Newton (Jansen et al. 2001) from 2000 July to 2019 December. We used a total of 33 epochs of X-ray observations, which are logged in Table A.1. All of the observations were obtained for other massive stars as the main target in the Eta Carinae field and HD 93250 was serendipitously found to lie in the same field of view of XMM-Newton. It was observed with different configurations of the three European Photon Imaging Camera (EPIC) instruments: MOS1, MOS2, and PN. The MOS1 and MOS2 cameras took data mostly in the prime-full imaging mode, but a few observations were also obtained in the prime-partial window–W2/W3 imaging modes. However, the PN camera operated either in prime-full or prime-large window mode. The data reduction was performed using the latest calibration files with SAS v20.0.0.
The raw EPIC Observation Data Files (ODFs) were pipeline processed using the tasks EPCHAIN and EMCHAIN for the PN and MOS data, respectively. The SAS task EVSELECT generated the list of event files by considering good events with pattern 0–4 for PN and 0–12 for MOS data. The data were found to be unaffected by pile-up after examining with the task EPAT-PLOT. To check the intervals of high background emission, full-frame light curves were generated considering the single-event (PATTERN = 0) in >10 keV energy range for MOS and that in the 10–12 keV band for PN. Good time intervals were selected by removing the intervals with abruptly high background. Typically, the filtering criterion excluded the intervals of count rates of higher than 0.20 counts s−1 for MOS and 0.4 counts s−1 for PN background light curves.
The PN image of HD 92350 obtained from observation ID 0311990101 in the 0.3–12.0 keV energy range is shown in Fig. 1. To estimate the source coordinates precisely, we made use of the standard source detection algorithm in the SAS through the meta-task EDETECT_CHAIN applied to PN data, which has better photon statistics than MOS detectors. The target source HD 93250 (S1) was detected at the position of Right Ascension (RA) (J2000) = 10:44:45.1200 and Declination (Dec) (J2000) = −59:33:52.920. Another source (S2) at position RA (J2000) = 10:44:46.5600 and Dec (J2000) = −59:34:10.200 was detected closest to the source position as shown in Fig. 1. Both of these sources were detected in the Chandra Carina Survey (Broos et al. 2011). Chandra has better sensitivity when determining precise source positions and our estimates agree well with the Chandra detection. The source S2 has been identified as a B5III-V type star named Cl* Trumpler 14 Y 66 emitting in X-rays (Vaidya et al. 2015). A circular region with a radius of 30 arcsec centered at the source coordinates was selected to accumulate enough counts for the extraction of EPIC light curves and spectra of HD 93250. To remove the contamination from the S2 neighboring X-ray source, the counts from another circular region of 10 arcsec in radius centered at the location of S2 were subtracted from the actual source region. This extraction radius accounts for an encircled energy fraction of about 60%1. Among the remaining maximum 40%, a fraction of more than one-third is outside of the S1 extraction region. Given the X-ray fluxes reported by Evans et al. (2003) (i.e., 2.3 × 10⁻¹² and 1.3 × 10⁻¹³ erg s−1 cm−2 for S1 and S2, respectively), we estimate that at most about 1.3 × 10⁻¹⁴erg s−1 cm−2 should contaminate the S1 extraction region. This corresponds to ~1% of the flux from our main target, confirming the very low contamination level. We also note that the counts measured in the S2 extraction region constitute ~5% of the total counts measured in the circular area around S1, in fair agreement with the Chandra values mentioned above.
Background estimation was done from an annular region with an inner and an outer radius of 10 and 30 arcsec, respectively, ensuring the same detector area for the background region as the source. The background region was chosen so to be as close as possible to the source in its surrounding source-free area in order to choose both the regions at nearly the same off-axis angle from the detector aim-point. It was also made sure that no source is detected in the selected background region by Chandra, which has better resolution and sensitivity than XMM-Newton–EPIC. The obtained light curves were further corrected for good time intervals, dead time, exposure, point-spread function, and background subtraction using the EPICLCCORR task. The source as well as the background spectra were generated by the task EVSELECT. The dedicated Ancillary Response Files (ARFs) and Response Matrix Files (RMFs) required for calibrating the energy and flux axes were calculated by the tasks ARFGEN and RMFGEN, respectively. The backscaling of the extracted spectra was done using the task BACKSCALE. In order to have a minimum of 15 counts per spectral bin, the EPIC spectra were grouped using GRPPHA. Further temporal and spectral analyses were performed using HEASoft version v6.29c.
HD 93250 was present in the field of view of MOS1 and MOS2 during most of the epochs of observation but was much less well exposed in the PN field of view because of CCD gaps of bad columns at several epochs. Therefore, we did not consider PN data any further in order to keep the current analysis consistent and coherent across the full-time series.
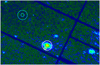 |
Fig. 1 XMM-Netwon–PN false-color image of HD 93250 from observation ID 0311990101. The white circle represents the source region of 30 arcsec in radius at the location of HD 93250. However, the X-ray counts from the neighboring source region of 10 arcsec in radius (in yellow color) were subtracted from the target light curve and spectra. The background has been estimated from an annular region (cyan color) of 10 and 30 arcsec in inner and outer radius in the source-free area of the detector. |
Log of NuSTAR observations of HD 93250.
2.2 Nustar observations of HD 93250
NuSTAR observed HD 93250 on eight occasions from 2014 July to 2020 August using both the focal plane modules (FPMA and FPMB). As most of these observations were performed for Eta Carinae, our target source is present at large offsets from the detector aim-point as shown in the NuSTAR log of observations in Table 1. Processing of NuSTAR data was done using the software NUSTARDAS V2.1.0 distributed by HEASARC within HEASoft 6.29. The task NUPIPELINE (version 0.4.9) was used to create calibrated, cleaned, and screened event files with NuSTAR CALDB version 20231121. To extract the source and background counts, circular regions of 40 arcsec radius at a source and nearby surrounding source-free regions, respectively, on the same detector were selected as shown in Fig. 2. The light curve and spectrum in the 3–78 keV energy range and corresponding response files were extracted using the NUPRODUCTS package within NUSTARDAS with a time binning of 10 s. The source counts in different energy bands were estimated and are mentioned in Table 1.
3 X-ray light-curve analysis
The background-subtracted X-ray light curves as observed by MOS1 on board XMM-Newton are shown in Fig. 3. These light curves were extracted in broad (0.3–10.0 keV), soft (0.3–2.0 keV), and hard (2.0–10.0 keV) energy bands. The X-ray variability is seen in all the energy band light curves with a comparatively lower count rate in the hard band.
We performed a Fourier transform (FT) of the MOS 1 and MOS2 light curve in the 0.3–10.0 keV energy band to search for a periodic signal using the Lomb-Scargle periodogram (Lomb 1976; Scargle 1982; Horne & Baliunas 1986). This is particularly effective in determining periodicity in the time series obtained over unequally spaced intervals of time. The FT showed a maximum power at a frequency of (5.972±0.041) × 10−8 s−1 for both the light curves. However, several other peaks were also present in the Lomb-Scargle power spectra, which may be due to the aliasing. Therefore, we also estimated the period using the CLEAN algorithm (Roberts et al. 1987) with a loop-gain of 0.1 and 100 iterations. The resulting power spectra presented in Fig. 4 show a dominant peak at a common frequency of 0.00516±0.00004 cycles per day (1σ uncertainty) for MOS1 in the 0.3–10.0 keV energy band. A similar peak was noted in the power spectra of MOS2. The consistent occurrence of the main peak at the same frequency in the two data sets lends strong support to its physical origin. However, most of the other features in the MOS2 power spectrum that are not found in the MOS1 data are artifacts that can be disregarded in our analysis. The peak frequency corresponds to a period of 193.8± 1.3 days and is consistent with the period derived by Le Bouquin et al. (2017).
In order to ascertain the variation of count rate with the orbital phase (ϕ), the light curves were folded using the ephemeris JD = 2454858.2+194.3E (Le Bouquin et al. 2017). The orbital phase was estimated at the middle of the total observing time. Each point in the folded X-ray light curves, depicted in Fig. 5 represents the average count rate of an observation ID observed by MOS1 and MOS2. Notably, the folded X-ray light curves of HD 93250 exhibit phase-locked modulations, with the count rate peaking around orbital phase zero and gradually decreasing as the system approaches phase 0.5. This behavior is consistent across all three energy bands. The maximum-to-minimum-count-rate ratio in the broad, soft, and hard energy bands (with 1σ uncertainty) is 1.38±0.03, 1.39±0.03, and 1.69±0.02 for MOS1, and 1.56±0.05, 1.55±0.06, and 1.66±0.02 for MOS2, respectively. It is worth noting that the difference in the effective detector area with thick and medium filters is only significant below 0.5 keV for MOS detectors. Above 0.5 keV, filter thickness does not significantly affect the count rates. In addition, most of the measured X-ray emission from the target is measured above 0.5 keV, with only a minor contribution down to 0.3 keV. Around 76% of the MOS observations were performed with thick optical blocking filters (see Table A.1), with a rather good orbital sampling. The minute variations due to filter thickness should therefore not affect the trends visible in the phase folded X-ray light curves of HD93250.
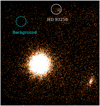 |
Fig. 2 NuSTAR–FPMA image of Eta-Carinae region in the 3.0–78.0 keV energy range from observation ID 30002010012. The source and background regions are highlighted with white and cyan circles, respectively, for the extraction of X-ray products. |
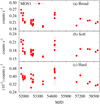 |
Fig. 3 X-ray light curves of HD 93250 as observed by XMM-Newton using MOS1 in broad (0.3–10.0 keV), soft (0.3–2.0 keV), and hard (2.0–10.0 keV) energy bands. Each point corresponds to the average count rate of an individual observation ID. |
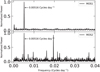 |
Fig. 4 CLEANed power spectra of HD 93250 in the 0.3–10.0 keV energy range using timing data from XMM-Newton–MOS1 and MOS2. The frequency of the peak with the highest power is also mentioned. |
4 X-ray spectral analysis
Given the nature of the system, we expect the X-ray emission to arise from both individual stellar winds (Feldmeier et al. 1997; Owocki et al. 2013), and from the shocked gas in the colliding-wind region (Stevens et al. 1992; Pittard & Parkin 2010). In line with usual studies for massive star systems, the X-ray spectrum can be modeled using APEC optically thin thermal emission components (e.g., Skinner et al. 2005; De Becker 2015; Arora et al. 2019). We adopted the reduced χ2 minimization approach as a goodness-of-fit criterion. We tested both two-temperature and three-temperature composite models to account for the temperature distribution of the X-ray-emitting plasma in the system. Overall, using only two emission components is found to be insufficient to achieve reasonable modeling in the broad EPIC band. The values of reduced χ2 obtained for two-temperature components of close to 2 dropped well below 1.4 for the three-temperature composite model. We thus focused on the three-temperature model. We also used two photoelectric absorption components (PHABS) to account for the interstellar absorption and the local absorption by the stellar wind material, respectively. We determined the interstellar column using the Hydrogen Column Density Calculator2, and fixed the value to  . The local column was left as a free parameter throughout all our fitting attempts. Our composite model was finally PHABS(ISM)* PHABS(LOCAL)*(APEC+APEC+APEC). Our spectral modeling assumes default solar abundances in XSPEC (Anders & Grevesse 1989). We note that we also cross-checked with other abundance lists (Asplund et al. 2009; Lodders 2003). However, this led to poorer constraints on the local absorbing column (mainly upper limits), preventing us from extracting valuable information on the varying column as a function of the orbital phase. This may be explained by the higher metallicity of recent abundance lists, which mean that the absorption component meant to account for ISM absorption leads to overestimation of its actual contribution. For the sake of the physical consistency of our spectral analysis, we focused on the results that allow a nonzero absorption by the stellar wind material. We stress that changing overall abundances should be taken with caution.
More recent abundances arising from inner Solar System measurements should by no means be viewed as an improvement in the assumed abundances for a source located 2.3 kpc away.
We froze some parameters to constrain the exploration of the parameter space and achieve a consistent set of solutions for the full-time series. We note that similar results were obtained for MOS1 and MOS2 spectra, and we focused on the simultaneous fitting of both MOS spectra of each epoch.
All emission model temperatures were frozen (kT1 = 0.26 keV, kT2 = 1.0 keV, and kT3 = 3.3 keV), keeping the local absorption column and the three normalization parameters free. With this approach, we obtained a consistent modeling series for the 33 epochs, including cases where the number of counts was too low to obtain adequate results in our first unconstrained attempts. All our results are presented in Table A.2. Reduced χ2 values range between 0.8 and 1.3. This is not significantly different from values obtained without any constraint on plasma temperatures, but the epoch-to-epoch consistency has been highly enhanced.
One of the modeled X-ray spectra of HD 93250 is shown in Fig. 6. We show the phase-folded time series of best-fit parameters, norm1, norm2, norm3, and  in Fig.7. Although we still notice some dispersion in the parameter values obtained at similar orbital phases, this constitutes our best set of results. The observed and ISM-corrected X-ray flux was also estimated in broad
  , soft
  , and hard
  energy bands. The variation of X-ray flux as a function of orbital phase is shown in Fig. 8 in different energy bands. The phase-locked X-ray flux variations are clearly displayed in this figure where it is maximum around the periastron and becomes minimum close to the apastron. Figure 9 displays the hard X-ray flux as a function of the varying binary separation (D/a; binary separation normalized with the semi-major axis “a” taken from Le Bouquin et al. 2017).
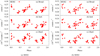 |
Fig. 5 Folded X-ray light curves of HD 93250 as observed by XMM-Newton using a MOS 1, and b MOS2 in broad, soft, and hard energy bands. |
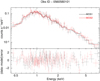 |
Fig. 6 MOS1 and MOS2 spectra of HD 93250 jointly fitted with the three-temperature thermal plasma emission model from the observation ID 0560580101. The details of the spectral fitting are provided in Table A.2. |
 |
Fig. 7 Variation of the local equivalent H-column density |


5 Discussion
5.1 X-ray luminosity
The spectral classification of HD 93250 is that of a pair of O4 stars, but the luminosity class has not yet been fully established. Typical masses for O4 stars reported by Martins et al. (2005) are about 46, 49, and 58 M⊙, for dwarfs, giants, and supergiants, respectively. Given the total mass for the system of 84 M⊙, as proposed by Le Bouquin et al. (2017), it is less likely that the stars are supergiants. As a result, in compliance with the luminosity classes proposed for the stars in HD 93250 (see Sect. 1), let us assume that their luminosity class ranges between V and III. Adopted typical bolometric luminosities for O4 stars for both luminosity classes are quoted in Table 2.
Assuming the distance to HD 93250 is about 2370 pc (Gaia DR3 catalog Bailer-Jones et al. 2021), we converted the fluxes corrected for interstellar absorption into X-ray luminosities. For this discussion, let us consider the minimum and maximum flux values obtained close to apastron (fX,min ~ 3.2 ×10⁻¹² erg cm−2s−1) and periastron (fX,max ~ 4.8 ×10⁻¹² erg cm−2s−1), respectively. This conversion gives LX,min ~ 2.15 × 1033 and Lx,max ~ 3.23 × 1033 erg s−1. We thus obtain ranges of LX/Lbol ratios (counting twice the individual Lbol) of (5.8–8.8 ) × 10−7 and (4.2–6.4) ×10−7, assuming dwarfs and giants, respectively. These values are significantly above the usual LX/Lbol ratio for single O stars of about 10−7, which is valid for stars sufficiently far from the transition to the WN type (Owocki et al. 2013; De Becker 2013). This X-ray luminosity excess is attributable to the thermal X-ray emission that arises from the colliding-wind region (CWR), in addition to the emission from individual stellar winds.
We must also address energy budget considerations regarding the wind kinetic power,
 (1)
(1)
where M−6 is the mass-loss rate in units of 10−6 M⊙ yr−1 and v∞,8 is the terminal velocity in units of 108 cms−1. Based on values quoted in Table 2 for wind parameters, we derived total Pkin values of 1.2 × 1037 and 1.58 × 1037 erg s−1 for the sum of both winds, assuming classes V and III, respectively. Quantifying the fraction of mechanical energy effectively converted into X-ray emission in the CWR requires estimation of LX,CWR, which is the contribution of the X-ray luminosity emerging from the system that is coming from the CWR. The measured LX has to be corrected for the contributions from the two stellar winds, which we assume to be 10−7 Lbol,
 (2)
(2)
Using Eq. (2), and considering the minimum and maximum values of LX, we obtain ranges of Lx,cwr of (1.78–2.86) × 1033 and (1.64–2.72)× 1033 erg s−1, respectively, for both considered luminosity classes. These numbers convert to LX,CWR/Pkin ratios of (1.5–2.4) × 10−4 and (1.0–1.7) × 10−4. These ratios are in agreement with other O-type systems with periods of several months or years (De Becker 2015).
Summary of the adopted parameters for the O4 components of HD 93250 assuming V and III luminosity classes (Martins et al. 2005; Muijres et al. 2012).
5.2 X-ray variability
The normalization parameter (Fig. 7) of the softest emission components does not display any specific trend. The dispersion is quite significant, with no noticeable increase close to periastron. We have to consider that the soft component is undoubtedly the one that is reproducing most of the soft X-ray emission from individual stellar winds (as a result of its lower preshock velocity). The relative contribution of the CWR emission is the weakest in that component, as compared to the other two emission components. On the contrary, the hardest component is the one that displays the clearest trend, with a significant and gradual increase in norm3, between apastron and periastron, reaching a peak at the latter orbital phase. The reverse trend appears to a certain extent when moving from periastron to apastron, but the time sampling of that half of the orbit is sparser. Given that the harder part of the spectrum is very likely dominated by the CWR emission (as a result of the greater preshock velocity as compared to intrinsic wind shocks), our discussion of the binary modulation should focus on that part. Regarding the evolution of the local hydrogen column, Fig. 7 suggests a peak between phases 0.5 and 1.0; that is, not coincident with periastron. This may be explained by the orientation of the system, which favors some enhanced local absorption when one of the stars is in front of a significant part of the CWR. However, we advise caution here, as the local absorption is sensitive to the softer part of the spectrum, which seems to be rather poorly constrained given the lack of a clear trend displayed by the normalization of the soft component. Apart from a very small number of deviant points, the trend displayed by the norm2 parameter is similar to that of norm3 but with a somewhat lower peak-to-bottom amplitude. The component with a plasma temperature of about 1.0 keV, emerges mostly due to the CWR, but there is still likely a smaller contribution from the individual stellar winds.
As illustrated by both count rates and fluxes, the X-ray emission significantly varies as a function of orbital phase, in full agreement with the ephemeris published by Le Bouquin et al. (2017). Given the wind parameters of the components of the system, one can estimate the cooling parameter (χ) as defined by Stevens et al. (1992) to establish the nature of the shock (adiabatic or radiative) in the CWR as
 (3)
(3)
where v is the preshock wind velocity in units of 1000 km s−1, D is the distance from the star to the shock in 107 km, and M is the mass-loss rate in 10−7 M⊙ yr−1. Aχ value well above 1 indicates a full adiabatic regime, implying that the X-ray emission from the CWR should follow a 1/D trend, where D is the stellar separation in the system. According to the parameters quoted in Table 2, for a stagnation point located midway between the two stars and a separation based on the astrometric orbit proposed by Le Bouquin et al. (2017), we determine that χ varies in the ranges of 520–813 and 119–185 assuming O4 V and O4 III components, respectively. In these ranges, the lower (upper) value corresponds to periastron (apastron). The estimated value is much greater than 1, warranting a full adiabatic regime. The 1/D variation of  is clearly manifested in Fig. 9.
When comparing apastron to periastron, the stellar separation changes by a factor (1 + e)/(1 − e), where e is the eccentricity. With an e = 0.22, the separation ratio is of the order 1.6. In addition, the ratio of maximum and minimum valuess of Lx,CWR given in Sect. 5.1 is 1.61 and 1.66 for V and III luminosity classes, respectively. These values are similar to the maximum-to-minimum-count-rate ratio obtained in the hard band (see Sect. 3) and the flux ratio from spectral analysis in the hard band (=1.67). One can also characterize the amplitude of the variation of the emission from the colliding winds through the periastron-to-apastron norm3 ratio, as this parameter scales with the emission measure of the hottest component, and we obtain about 1.5. These values are in relatively good agreement with the expected separation ratio. It is interesting to note that based on our measured ratios (r), we would estimate the eccentricity e = (r − l)/(r + 1) of the system to be in the range of 0.20–0.25, demonstrating the strength of this approach in estimating some basic orbital parameters even in the absence of a fully independent orbital solution.
Regarding the local absorption by the wind material, we caution that the use of a slab-geometry model such as the one used in this study leads to limitations in possible interpretations. Ideally, a full hydro-radiative simulation of the binary system should more consistently account for this effect, but this is far beyond the scope of the present study. If the target were a single star wind, the ideal approach to account for local wind absorption would be the one developed by Leutenegger et al. (2010). However, given the binary nature of the system (including stellar winds and their collision), no appropriate tool is at our disposal. The simple modeling by a slab-geometry model is however enough to achieve a qualitative description of the overall behavior of the system, especially in terms of the orbital modulation of the thermal X-ray flux.
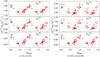 |
Fig. 8 Variation of the (a) observed (Fobs) and (b) ISM-corrected (Fism) X-ray flux in broad, soft, and hard energy bands from HD 93250 obtained after X-ray spectral fitting as a function of the binary orbital phase (see Table A.2). |
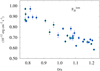 |
Fig. 9 Variation of the ISM-corrected X-ray flux in 2.0-10.0 keV energy range <ieq> from HD 93250 obtained after X-ray spectral fitting as a function of the binary separation (D normalized to semi-major axis “a”). |
5.3 HD 93250 in hard X-rays
NuSTAR data provide an opportunity to investigate hard X-rays from HD 93250. In the context of colliding-wind binaries, hard X-ray emission could arise from inverse Compton (IC) scattering of photospheric photons by relativistic electrons accelerated by shocks in the colliding-wind region. This has been confirmed in the case of two massive binaries: η Car (Hamaguchi et al. 2018) and Apep (del Palacio et al. 2023). Given that HD 93250 is known to be a particle accelerator thanks to its nonthermal radio emission (see Sect. 5.4), it is worth considering its potential non-thermal emission in X-rays, which requires investigation of the photon energies above 10 keV to avoid severe contamination by thermal X-rays (De Becker 2007).
HD 93250 appears as a weak point source on the NuSTAR image (Fig. 2). Figure 10 shows spectra extracted in the source and background regions. While some excess emission attributable to thermal emission from the source is measured in the soft part of the spectrum, no significant excess emission is detected above 10 keV. The source counts in 10.0–78.0 keV for all of the epochs of the NuSTAR observations given in Table 1 were of the order of the background counts. We can thus claim that no nonthermal emission is detected.
We determined upper limits on the hard-X-ray emission using the same approach as Arora et al. (2019). To do so, we selected observation ID 30402001004, as it is the closest to periastron passage and is expected to coincide with a maximum in IC emission (proportional to the local radiative energy density). First, we measured the number of counts in the source region above 10 keV. According to Harrison et al. (2013), a 40 arcsecond extraction radius corresponds to an encircled energy fraction of 60%, and at an offset of 8 arcminutes, the effective area is about 25% of the maximum. Applying these two corrections yields a corrected count number, Ccor. We determined a count threshold (Cmax) corresponding to a logarithmic likelihood (L) of 12, translating into a probability (P) of finding a count number in excess of Cmax of about 6 × 10⁻⁶ (L = −ln P), under the null hypothesis of pure background Poisson fluctuations. We then divided the count excess (Cmax − Ccor) by the effective exposure time to determine an upper limit on the count rate. Our results are summarized in Table 3.
Based on these count-rate upper limits, we used the WebPIMMS online tool3 to estimate the corresponding flux, assuming a power-law emission with a photon index equal to 1.5. The latter value is expected for relativistic electrons accelerated through diffusive shock acceleration in the test-particle regime by adiabatic, high-Mach-number shocks. We obtain an upper limit on the flux between 0.1 and 100 keV of the order of 1.5 × 10⁻¹² erg cm−2 s−1, which can be converted to a luminosity of the order of 1033 erg s−1. This corresponds to a fraction of the order of 10−4 of the total wind kinetic power of the system (see Sect. 5.1). As a comparison, del Palacio et al. (2023) report a conversion efficiency of kinetic power to IC scattering of about 1.5 × 10⁻⁴ in the case of Apep, which is slightly above our limit for HD 93250. Given the sensitivity of NuSTAR, provided our target is indeed producing nonthermal X-rays, it is injecting too little energy in nonthermal processes to allow a detection. This is fully in agreement with the idea that nonthermal X-ray emitters have a chance to be revealed provided a sufficient input energy reservoir, which is their wind kinetic power. This is the main factor behind the sparsity of detections reported so far.
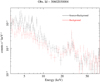 |
Fig. 10 NuSTAR-FPMA spectra extracted at the position of HD 93250 and from the background region as indicated in Fig. 2. |
Upper limits on the count rate from NuSTAR data.
5.4 Considerations about the radio emission from HD 93250
Besides the thermal X-ray emission from the colliding winds and considerations about nonthermal X-rays, it is relevant to consider the question of the synchrotron radio emission associated with shocks in the CWR of tens of massive binaries (De Becker & Raucq 2013; De Becker et al. 2017). In this context, the synchrotron radio emission is also seen as a signature of colliding winds.
In order to investigate the nature of the radio emission from HD 93250, Leitherer et al. (1995) observed it at frequencies of 8.64 and 4.80 GHz. The source was detected only at 8.64 GHz with a flux density of 1.36 ± 0.17 mJy. Assuming this radio emission was only due to a single star wind, the subsequent derivation of the associated mass-loss rate pointed toward an excessive value, suggesting the measured radio emission was not only due to thermal free-free emission from a single star wind. As this was likely attributable to a nonthermal contribution in the spectrum, this led HD 93250 to be included in the catalog of particle-accelerating colliding-wind binaries (PACWBs, De Becker & Raucq 2013), although it was tagged with a low confirmation level flag. Besides the X-ray emission from the CWR investigated in this paper, this potential synchrotron radio emission constitutes a second aspect of the shock physics associated with its binarity.
In light of the revision of the properties of HD 93250 since the publication by Leitherer et al. (1995), it is certainly relevant to reconsider the question of its radio emission. We estimated the free-free thermal radio emission from the winds of the components of HD 93250 following the approach described by De Becker (2018, see their Appendix B), which is based on the theoretical development established by Wright & Barlow (1975). In agreement with the prescription we applied in Sect. 5.1, let us consider both dwarf and giant luminosity classes. We used the parameters quoted in Table 2 along with a clumping factor of 4, the main effect of which is to enhance the thermal free-free emission for a given value of the mass-loss rate (not considered at the time of the radio measurement). As for the X-ray emission, the putative synchrotron radio emission should emerge from the CWR, in addition to the thermal free-free emission from the two winds. Adding together the predicted flux density from the two stellar winds in HD 93250, assuming main sequence stars, we obtain about 0.02 mJy at 4.8 GHz and 0.03 mJy at 8.6 GHz; alternatively, assuming giant stars, we obtain about 0.08 mJy at 4.8 GHz and 0.11 mJy at 8.6 GHz. We can thus conclude that the measurement at 8.6 GHz made by Leitherer et al. (1995) is at least one order of magnitude brighter than our prediction for pure thermal emission. As uncertainties on the selected parameters are unlikely to lead to such a large discrepancy in our prediction, we confirm that the unique radio measurement of the system is pointing to a likely PACWB status.
At the time of this unique radio measurement (7–9 September 1994), according to the ephemeris of Le Bouquin et al. (2017) the orbital phase was almost coincident with periastron. This may explain a significant attenuation of the synchrotron emission due to free-free absorption by the stellar wind material (more pronounced at 4.80 GHz than at 8.64 GHz). The case of HD 93250 certainly merits additional radio measurements to clarify its behavior.
6 Summary and conclusions
We present a detailed analysis of the O4 + O4 binary system HD 93250 in soft and hard X-rays. In light of the characterization of the astrometric orbit of the system, all good-quality archived data sets obtained with XMM-Newton were used, providing a total of 33 epochs spread over about 19 yr. Time series analysis based on count rates reveals a period of 193.8 ± 1.3 d, in full agreement with the orbital period determined by Le Bouquin et al. (2017). This suggests that a significant fraction of X-rays measured in the EPIC bandpass arise from the colliding-wind region. This statement is notably reinforced by the morphology of the spectrum, which is moderately hard, as expected from a plasma heated by colliding wind at speeds of a few thousand km s−1.
The spectral analysis reveals an X-ray spectrum compatible with optically thin thermal emission by a plasma with a temperature distribution ranging from a few 106 K to several 107 K. Our best results were obtained using an absorbed (interstellar and local) three-temperature model. Considering the need to perform physically consistent modeling, we explored the parameter space to converge a set of valid parameters with the strong requirement to display a smooth evolution as a function of orbital phase. The best physically valid set of solutions was obtained by freezing the plasma temperatures, allowing the normalization parameters and  to vary.
Depending on the assumption of the luminosity class of the stars (V or III), the over-luminosity factor (as compared to the expected emission from noninteracting winds) ranges between 3 and 7, in agreement once again with a significant contribution of the X-ray emission from the CWR. We also estimate that the fraction of the wind kinetic power converted into thermal X-rays in the CWR is of the order of a few times 10−4, in agreement with other O-type systems with periods of at least several months. A lack of detection of HD 93250 above 10 keV based on NuSTAR data has been reported, and we determined an upper limit on the putative inverse Compton scattering emission that is about 10−4 times the wind kinetic power in the system.
We re-evaluated the question of the PACWB status of HD 93250. Based on the expected wind parameters, the calculated expected thermal free-free emission from individual stellar winds is about one order of magnitude too low to explain the unique existing radio measurement, lending support to the idea it is indeed a synchrotron radio emitter. However, a unique measurement is not enough to characterize its behavior. In addition to the thermal X-ray emission investigated in detail in this paper, the nonthermal emission in the radio domain constitutes a second aspect of shock physics in colliding-wind binaries that still needs to be tackled for this system.
Finally, we stress that X-ray times series constitute relevant independent tools for identifying massive binaries, determining their orbital period, and estimating their eccentricity, provided sufficient sampling of the orbit. This is relevant in terms of the efficiency of indirect techniques, such as X-ray time analysis, to investigate the multiplicity of massive stars and extract relevant information on their basic orbital parameters independently of more classical methods based on radial velocity curves or astrometric monitoring.
Acknowledgements
We thank the referee for the careful reading of the manuscript and giving us constructive comments and suggestions. B.A. acknowledges the grant provided by Wallonia Brussels International to carry out this work. This research has made use of observations obtained with XMM–Newton, an ESA science mission with instruments and contributions directly funded by ESA Member States and NASA. Additionally, NuSTAR data has been utilized which is a project led by the California Institute of Technology, managed by the Jet Propulsion Laboratory, and funded by the National Aeronautics and Space Administration.
Appendix A Additional tables
Log of XMM-Newton observations of HD 93250.
Best-fit parameters obtained from spectral fitting of HD 93250 as observed from XMM-Newton-EPIC.
References
- Anders, E., & Grevesse, N. 1989, Geochim. Cosmochim. Acta, 53, 197 [Google Scholar]
- Antokhin, I. I., Rauw, G., Vreux, J. M., van der Hucht, K. A., & Brown, J. C. 2008, A&A, 477, 593 [NASA ADS] [CrossRef] [EDP Sciences] [Google Scholar]
- Arora, B., Pandey, J. C., & De Becker, M. 2019, MNRAS, 487, 2624 [Google Scholar]
- Asplund, M., Grevesse, N., Sauval, A. J., & Scott, P. 2009, ARA&A, 47, 481 [NASA ADS] [CrossRef] [Google Scholar]
- Bailer-Jones, C. A. L., Rybizki, J., Fouesneau, M., Demleitner, M., & Andrae, R. 2021, AJ, 161, 147 [Google Scholar]
- Broos, P. S., Townsley, L. K., Feigelson, E. D., et al. 2011, ApJS, 194, 2 [NASA ADS] [CrossRef] [Google Scholar]
- De Becker, M. 2007, A&A Rev., 14, 171 [CrossRef] [Google Scholar]
- De Becker, M. 2013, New Astron., 25, 7 [NASA ADS] [CrossRef] [Google Scholar]
- De Becker, M. 2015, MNRAS, 451, 1070 [Google Scholar]
- De Becker, M. 2018, A&A, 620, A144 [NASA ADS] [CrossRef] [EDP Sciences] [Google Scholar]
- De Becker, M., & Raucq, F. 2013, A&A, 558, A28 [NASA ADS] [CrossRef] [EDP Sciences] [Google Scholar]
- De Becker, M., Benaglia, P., Romero, G. E., & Peri, C. S. 2017, A&A, 600, A47 [NASA ADS] [CrossRef] [EDP Sciences] [Google Scholar]
- del Palacio, S., García, F., De Becker, M., et al. 2023, A&A, 672, A109 [NASA ADS] [CrossRef] [EDP Sciences] [Google Scholar]
- Evans, N. R., Seward, F. D., Krauss, M. I., et al. 2003, ApJ, 589, 509 [NASA ADS] [CrossRef] [Google Scholar]
- Feldmeier, A., Puls, J., & Pauldrach, A. W. A. 1997, A&A, 322, 878 [NASA ADS] [Google Scholar]
- Gagné, M., Fehon, G., Savoy, M. R., et al. 2011, ApJS, 194, 5 [CrossRef] [Google Scholar]
- Gies, D. R. 1987, ApJS, 64, 545 [NASA ADS] [CrossRef] [Google Scholar]
- Hamaguchi, K., Corcoran, M. F., Pittard, J. M., et al. 2018, Nat. Astron., 2, 731 [CrossRef] [Google Scholar]
- Harrison, F. A., Craig, W. W., Christensen, F. E., et al. 2013, ApJ, 770, 103 [Google Scholar]
- Horne, J. H., & Baliunas, S. L. 1986, ApJ, 302, 757 [Google Scholar]
- Jansen, F., Lumb, D., Altieri, B., et al. 2001, A&A, 365, L1 [NASA ADS] [CrossRef] [EDP Sciences] [Google Scholar]
- Le Bouquin, J. B., Sana, H., Gosset, E., et al. 2017, A&A, 601, A34 [NASA ADS] [CrossRef] [EDP Sciences] [Google Scholar]
- Leitherer, C., Chapman, J. M., & Koribalski, B. 1995, ApJ, 450, 289 [NASA ADS] [CrossRef] [Google Scholar]
- Leutenegger, M. A., Cohen, D. H., Zsargó, J., et al. 2010, ApJ, 719, 1767 [CrossRef] [Google Scholar]
- Lodders, K. 2003, ApJ, 591, 1220 [Google Scholar]
- Lomb, N. R. 1976, Ap&SS, 39, 447 [Google Scholar]
- Maíz Apellániz, J., Sota, A., Arias, J. I., et al. 2016, ApJS, 224, 4 [CrossRef] [Google Scholar]
- Martins, F., Schaerer, D., & Hillier, D. J. 2005, A&A, 436, 1049 [NASA ADS] [CrossRef] [EDP Sciences] [Google Scholar]
- Muijres, L. E., Vink, J. S., de Koter, A., Müller, P. E., & Langer, N. 2012, A&A, 537, A37 [NASA ADS] [CrossRef] [EDP Sciences] [Google Scholar]
- Owocki, S. P., Sundqvist, J. O., Cohen, D. H., & Gayley, K. G. 2013, MNRAS, 429, 3379 [NASA ADS] [CrossRef] [Google Scholar]
- Penny, L. R. 1996, ApJ, 463, 737 [Google Scholar]
- Pittard, J. M., & Parkin, E. R. 2010, MNRAS, 403, 1657 [NASA ADS] [CrossRef] [Google Scholar]
- Rauw, G., Nazé, Y., Fernández Lajús, E., et al. 2009, MNRAS, 398, 1582 [NASA ADS] [CrossRef] [Google Scholar]
- Roberts, D. H., Lehar, J., & Dreher, J. W. 1987, AJ, 93, 968 [Google Scholar]
- Sana, H., Le Bouquin, J. B., De Becker, M., et al. 2011, ApJ, 740, L43 [NASA ADS] [CrossRef] [Google Scholar]
- Scargle, J. D. 1982, ApJ, 263, 835 [Google Scholar]
- Seward, F. D., Forman, W. R., Giacconi, R., et al. 1979, ApJ, 234, L55 [NASA ADS] [CrossRef] [Google Scholar]
- Skinner, S. L., Zhekov, S. A., Palla, F., & Barbosa, C. L. D. R. 2005, MNRAS, 361, 191 [NASA ADS] [CrossRef] [Google Scholar]
- Stevens, I. R., Blondin, J. M., & Pollock, A. M. T. 1992, ApJ, 386, 265 [Google Scholar]
- Thackeray, A. D., Tritton, S. B., & Walker, E. N. 1973, MmRAS, 77, 199 [NASA ADS] [Google Scholar]
- Vaidya, K., Chen, W.-P., & Lee, H.-T. 2015, AJ, 150, 195 [NASA ADS] [CrossRef] [Google Scholar]
- Walborn, N. R. 1971, ApJ, 167, L31 [CrossRef] [Google Scholar]
- Walborn, N. R. 1972, AJ, 77, 312 [NASA ADS] [CrossRef] [Google Scholar]
- Walborn, N. R. 1982, ApJ, 254, L15 [NASA ADS] [CrossRef] [Google Scholar]
- Walborn, N. R., Howarth, I. D., Lennon, D. J., et al. 2002, AJ, 123, 2754 [NASA ADS] [CrossRef] [Google Scholar]
- Walborn, N. R., Sota, A., Maíz Apellániz, J., et al. 2010, ApJ, 711, L143 [NASA ADS] [CrossRef] [Google Scholar]
- Williams, S. J., Gies, D. R., Hillwig, T. C., McSwain, M. V., & Huang, W. 2011, AJ, 142, 146 [NASA ADS] [CrossRef] [Google Scholar]
- Wright, A. E., & Barlow, M. J. 1975, MNRAS, 170, 41 [Google Scholar]
All Tables
Summary of the adopted parameters for the O4 components of HD 93250 assuming V and III luminosity classes (Martins et al. 2005; Muijres et al. 2012).
Best-fit parameters obtained from spectral fitting of HD 93250 as observed from XMM-Newton-EPIC.
All Figures
|
Fig. 1 XMM-Netwon–PN false-color image of HD 93250 from observation ID 0311990101. The white circle represents the source region of 30 arcsec in radius at the location of HD 93250. However, the X-ray counts from the neighboring source region of 10 arcsec in radius (in yellow color) were subtracted from the target light curve and spectra. The background has been estimated from an annular region (cyan color) of 10 and 30 arcsec in inner and outer radius in the source-free area of the detector. |
| In the text | |
|
Fig. 2 NuSTAR–FPMA image of Eta-Carinae region in the 3.0–78.0 keV energy range from observation ID 30002010012. The source and background regions are highlighted with white and cyan circles, respectively, for the extraction of X-ray products. |
| In the text | |
|
Fig. 3 X-ray light curves of HD 93250 as observed by XMM-Newton using MOS1 in broad (0.3–10.0 keV), soft (0.3–2.0 keV), and hard (2.0–10.0 keV) energy bands. Each point corresponds to the average count rate of an individual observation ID. |
| In the text | |
|
Fig. 4 CLEANed power spectra of HD 93250 in the 0.3–10.0 keV energy range using timing data from XMM-Newton–MOS1 and MOS2. The frequency of the peak with the highest power is also mentioned. |
| In the text | |
|
Fig. 5 Folded X-ray light curves of HD 93250 as observed by XMM-Newton using a MOS 1, and b MOS2 in broad, soft, and hard energy bands. |
| In the text | |
|
Fig. 6 MOS1 and MOS2 spectra of HD 93250 jointly fitted with the three-temperature thermal plasma emission model from the observation ID 0560580101. The details of the spectral fitting are provided in Table A.2. |
| In the text | |
|
Fig. 7 Variation of the local equivalent H-column density |
| In the text | |
|
Fig. 8 Variation of the (a) observed (Fobs) and (b) ISM-corrected (Fism) X-ray flux in broad, soft, and hard energy bands from HD 93250 obtained after X-ray spectral fitting as a function of the binary orbital phase (see Table A.2). |
| In the text | |
|
Fig. 9 Variation of the ISM-corrected X-ray flux in 2.0-10.0 keV energy range <ieq> from HD 93250 obtained after X-ray spectral fitting as a function of the binary separation (D normalized to semi-major axis “a”). |
| In the text | |
|
Fig. 10 NuSTAR-FPMA spectra extracted at the position of HD 93250 and from the background region as indicated in Fig. 2. |
| In the text | |
Current usage metrics show cumulative count of Article Views (full-text article views including HTML views, PDF and ePub downloads, according to the available data) and Abstracts Views on Vision4Press platform.
Data correspond to usage on the plateform after 2015. The current usage metrics is available 48-96 hours after online publication and is updated daily on week days.
Initial download of the metrics may take a while.