Fig. 7
Download original image
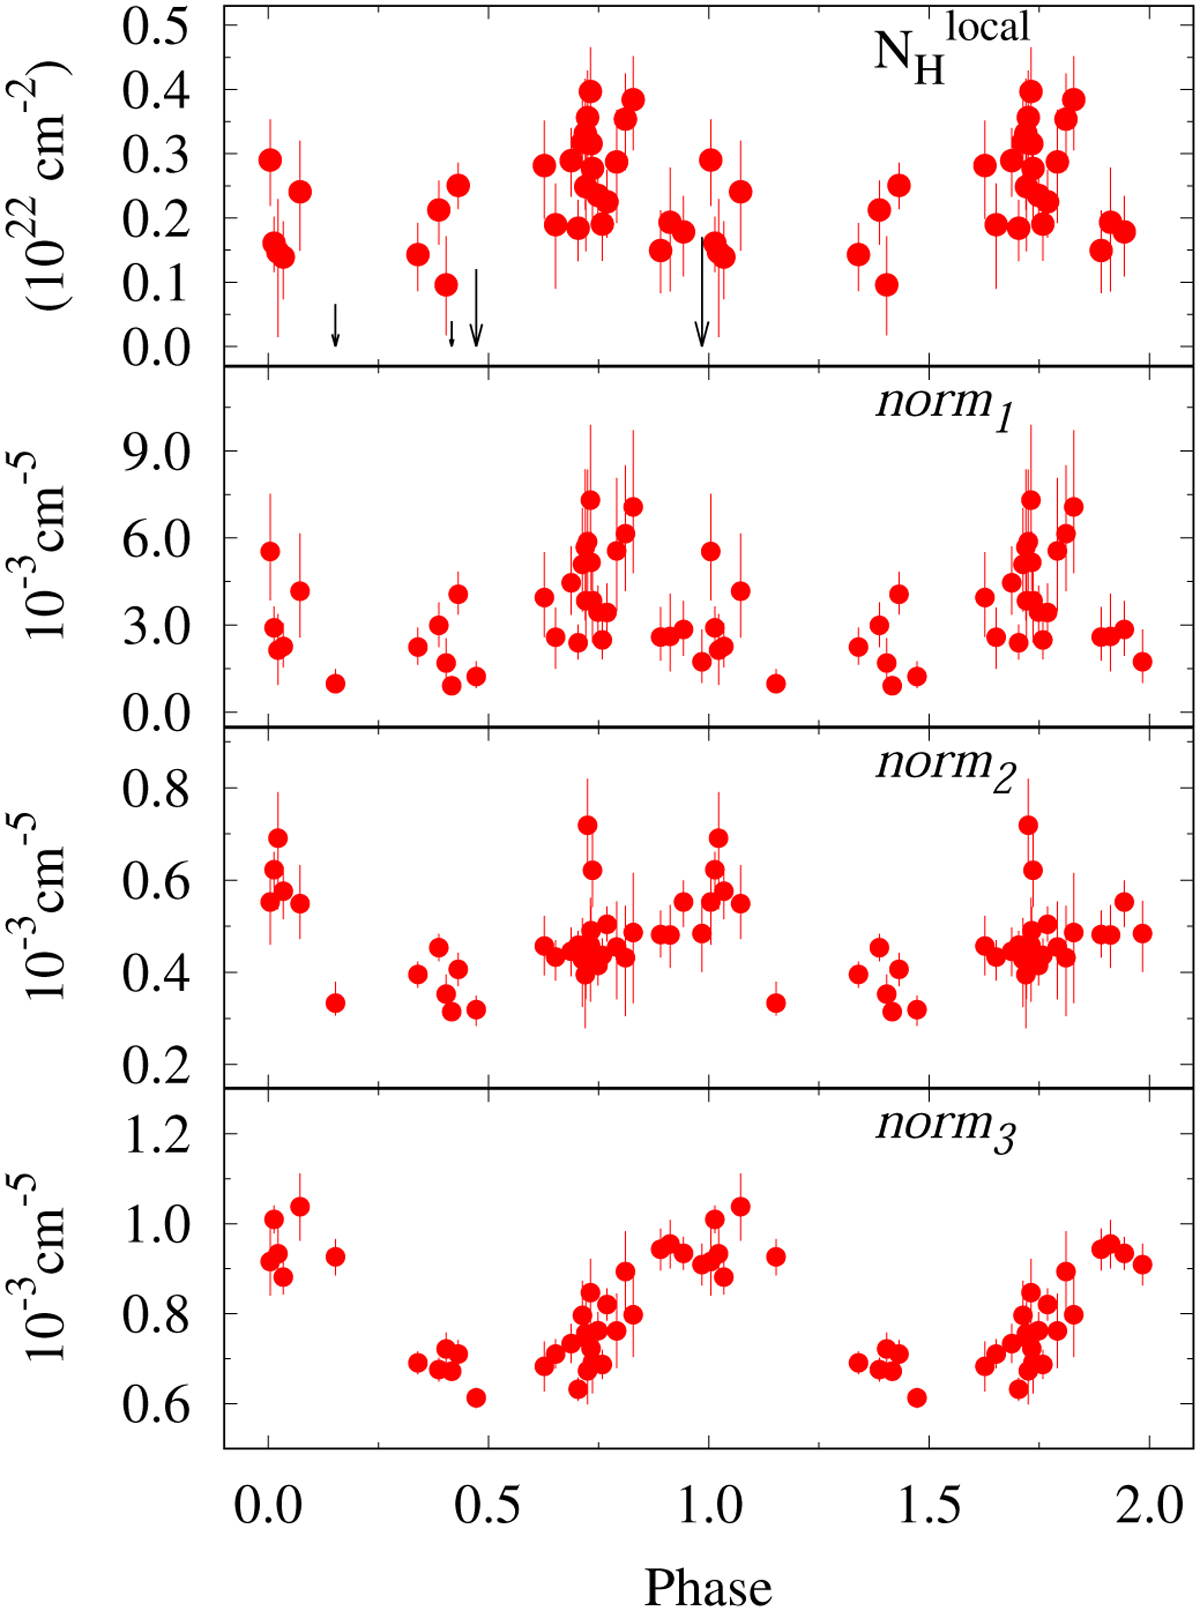
Variation of the local equivalent H-column density ![]() and normalization constants (norm1, norm2 and norm3) corresponding to three thermal plasma emission components with the orbital phase of HD 93250. The vertical arrows in the top most panel display the upper limit values of
and normalization constants (norm1, norm2 and norm3) corresponding to three thermal plasma emission components with the orbital phase of HD 93250. The vertical arrows in the top most panel display the upper limit values of ![]() at specific orbital phases obtained after X-ray spectral fitting (see Table A.2).
at specific orbital phases obtained after X-ray spectral fitting (see Table A.2).
Current usage metrics show cumulative count of Article Views (full-text article views including HTML views, PDF and ePub downloads, according to the available data) and Abstracts Views on Vision4Press platform.
Data correspond to usage on the plateform after 2015. The current usage metrics is available 48-96 hours after online publication and is updated daily on week days.
Initial download of the metrics may take a while.