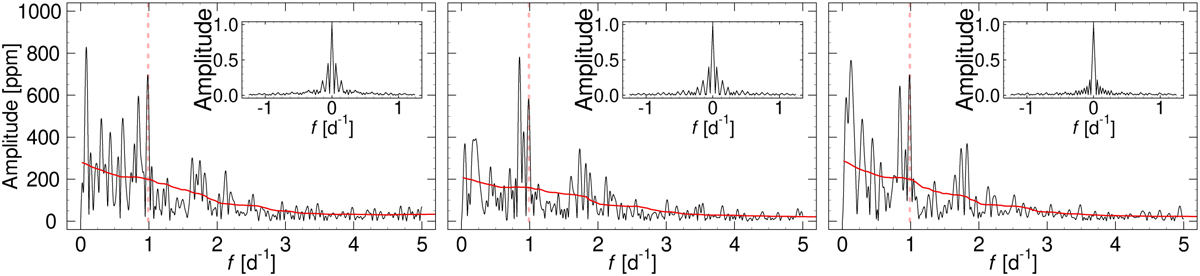
Fig. 6
Download original image
Fourier spectrum of the residuals of the LC model of WASP-167 from Sectors 10, 37, and 64 (left, middle, and right panel). The plots in the insets show the spectral windows. The dashed red line marks the second orbital harmonic of WASP-167b, demonstrating the critical frequency that influences primarily the mass measurements of the planet. The noise level, as calculated by Period04, is shown as a solid red line.
Current usage metrics show cumulative count of Article Views (full-text article views including HTML views, PDF and ePub downloads, according to the available data) and Abstracts Views on Vision4Press platform.
Data correspond to usage on the plateform after 2015. The current usage metrics is available 48-96 hours after online publication and is updated daily on week days.
Initial download of the metrics may take a while.