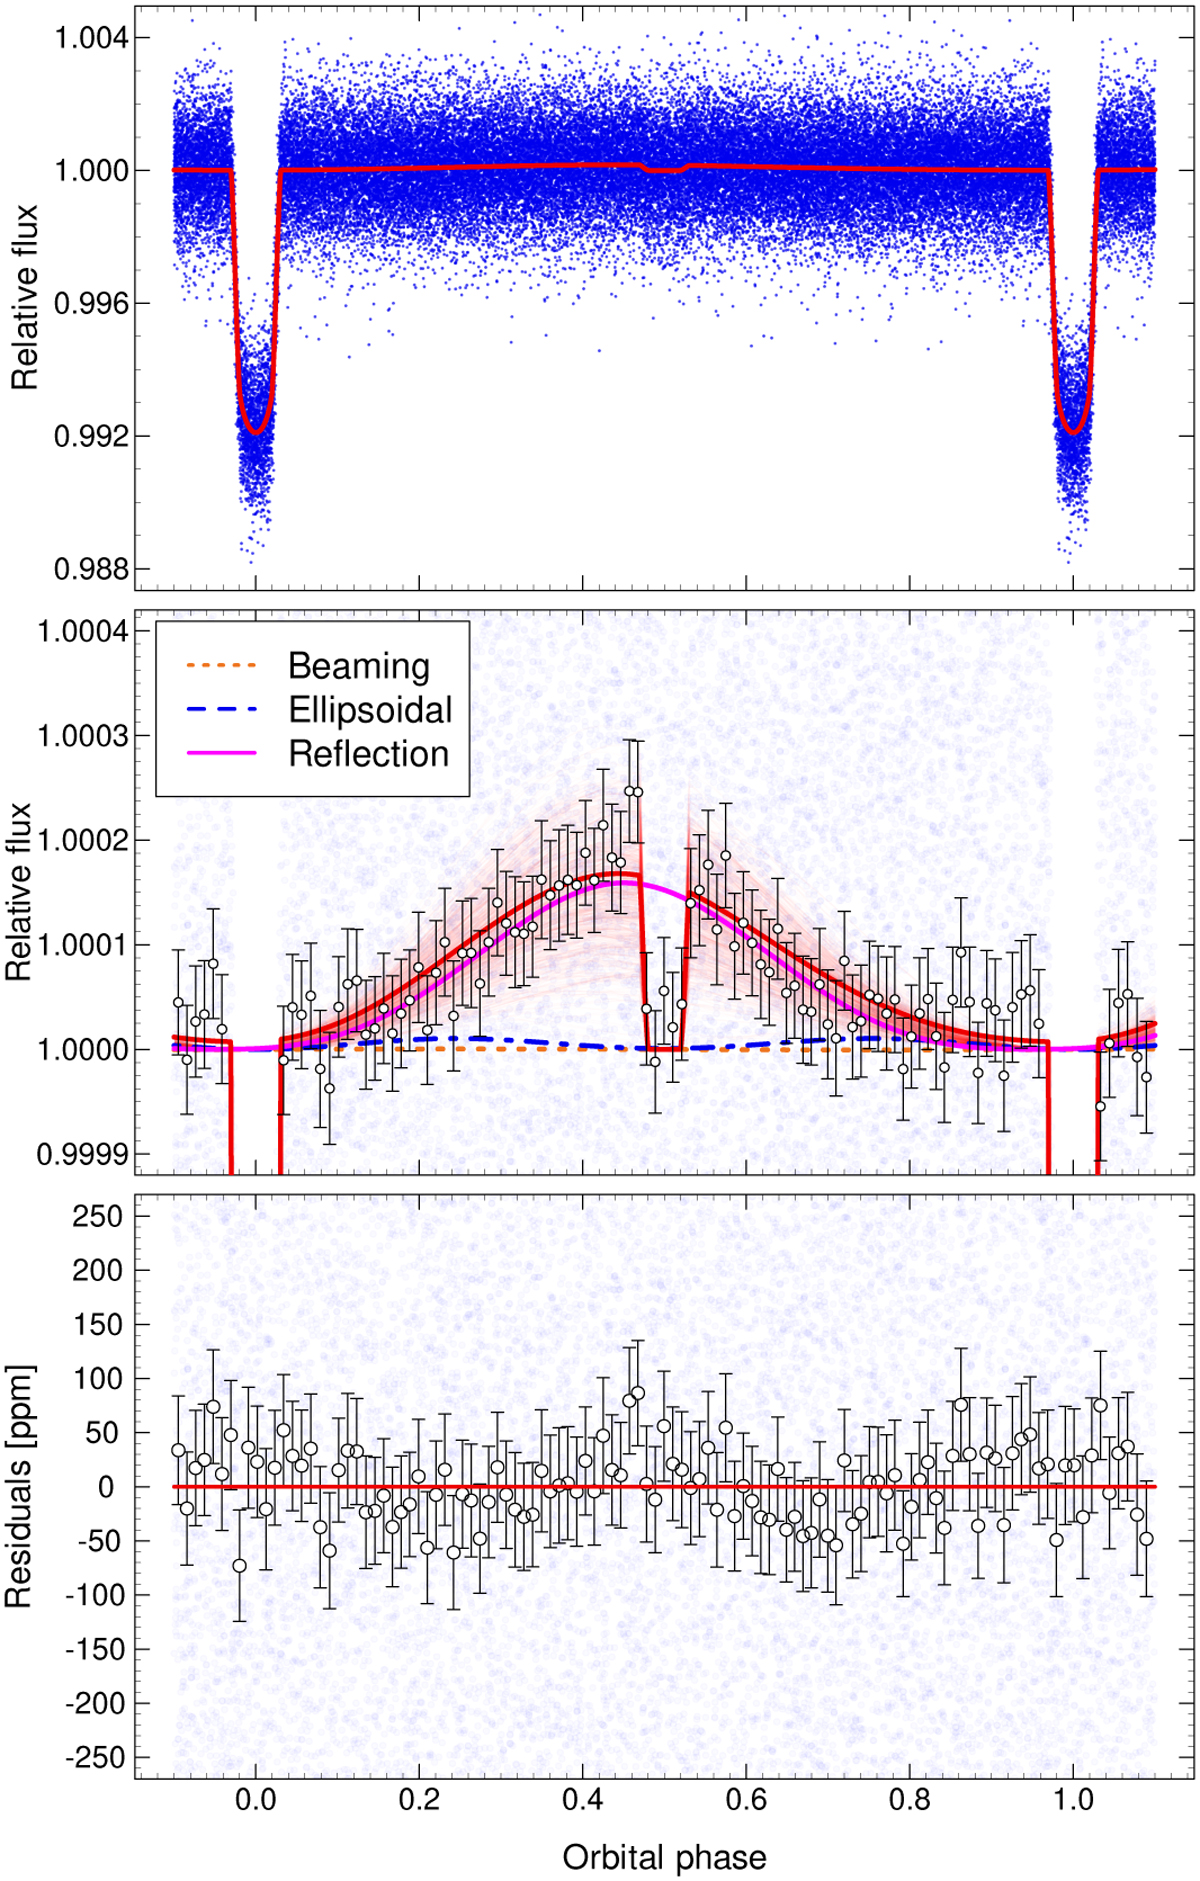
Fig. 5
Download original image
Full phase curve model of WASP-167b (solid red line). The top panel shows the Φ16(t) light curve with the fitted red noise subtracted via the wavelet-based filtering algorithm. The occultation is clearly visible in the zoomed-in middle panel, with the reflection effect, ellipsoidal variability, and Doppler beaming separated (magenta, blue, and orange lines, respectively). The residuals are shown in the bottom panel. The white circles and the respective error bars represent bins of 500 data points each. The less opaque red lines corresponding to 1000 model LCs were randomly selected from the uncertainty ranges of each of the parameters.
Current usage metrics show cumulative count of Article Views (full-text article views including HTML views, PDF and ePub downloads, according to the available data) and Abstracts Views on Vision4Press platform.
Data correspond to usage on the plateform after 2015. The current usage metrics is available 48-96 hours after online publication and is updated daily on week days.
Initial download of the metrics may take a while.