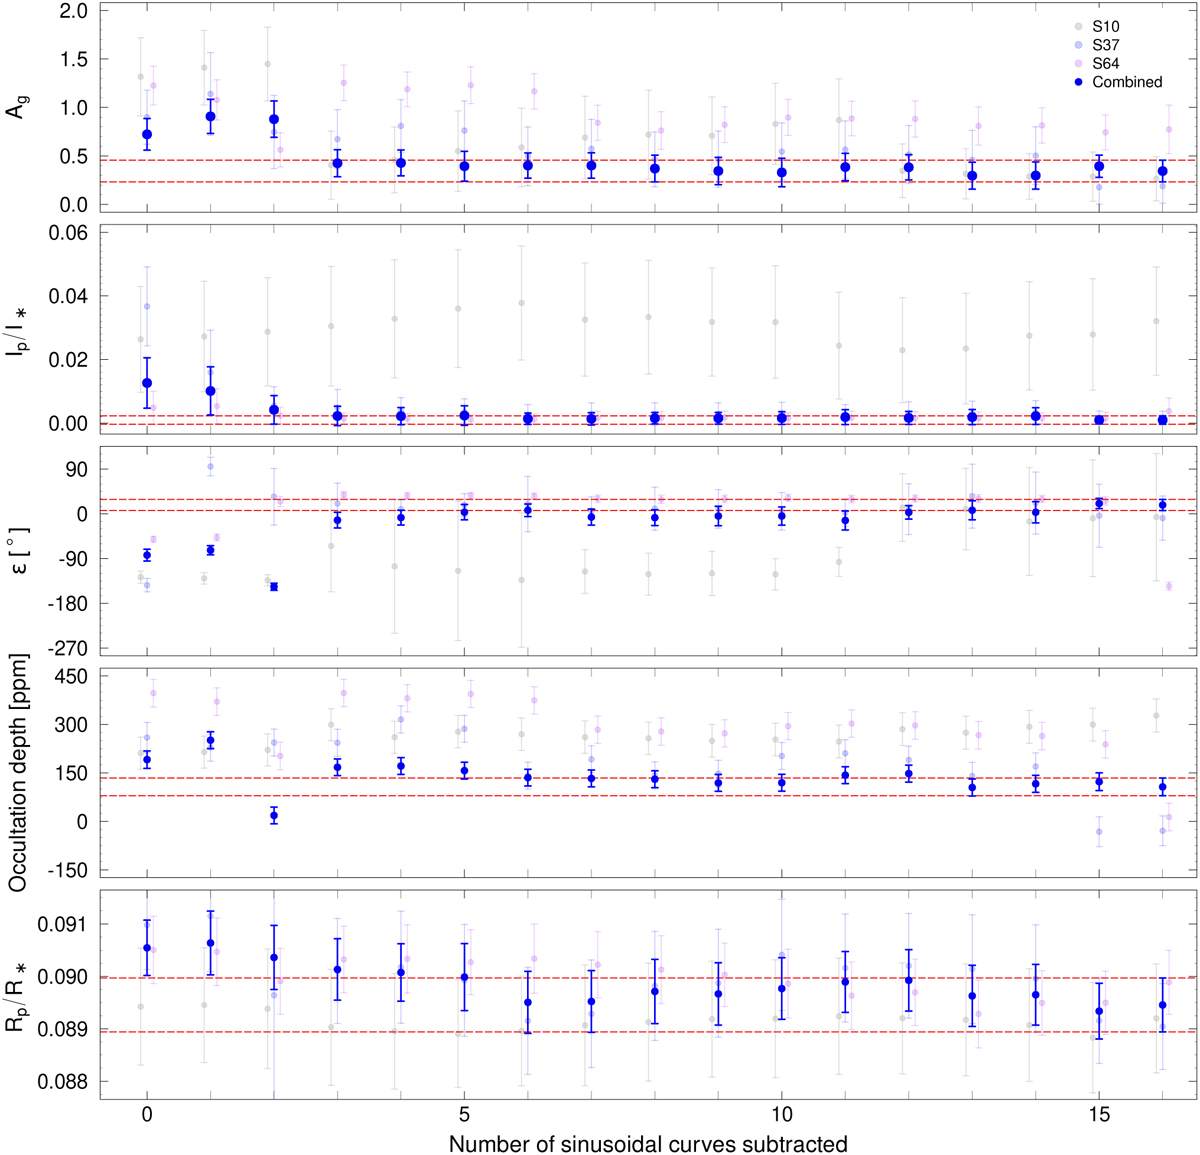
Fig. B.3
Download original image
Behaviour of the best-fit Ag, Ip/I★, occultation depth and Rp/R★ parameters with respect to the pre-whitening. The dark blue dots with error bars and the red dashed lines are the same as in Fig. 3. The respective parameters from Sector 10, 37, and 64 are shown in grey, light blue, and pink, respectively. The pink points and error bars are also slightly offset on the x-axis for better visibility.
Current usage metrics show cumulative count of Article Views (full-text article views including HTML views, PDF and ePub downloads, according to the available data) and Abstracts Views on Vision4Press platform.
Data correspond to usage on the plateform after 2015. The current usage metrics is available 48-96 hours after online publication and is updated daily on week days.
Initial download of the metrics may take a while.