Fig. 1
Download original image
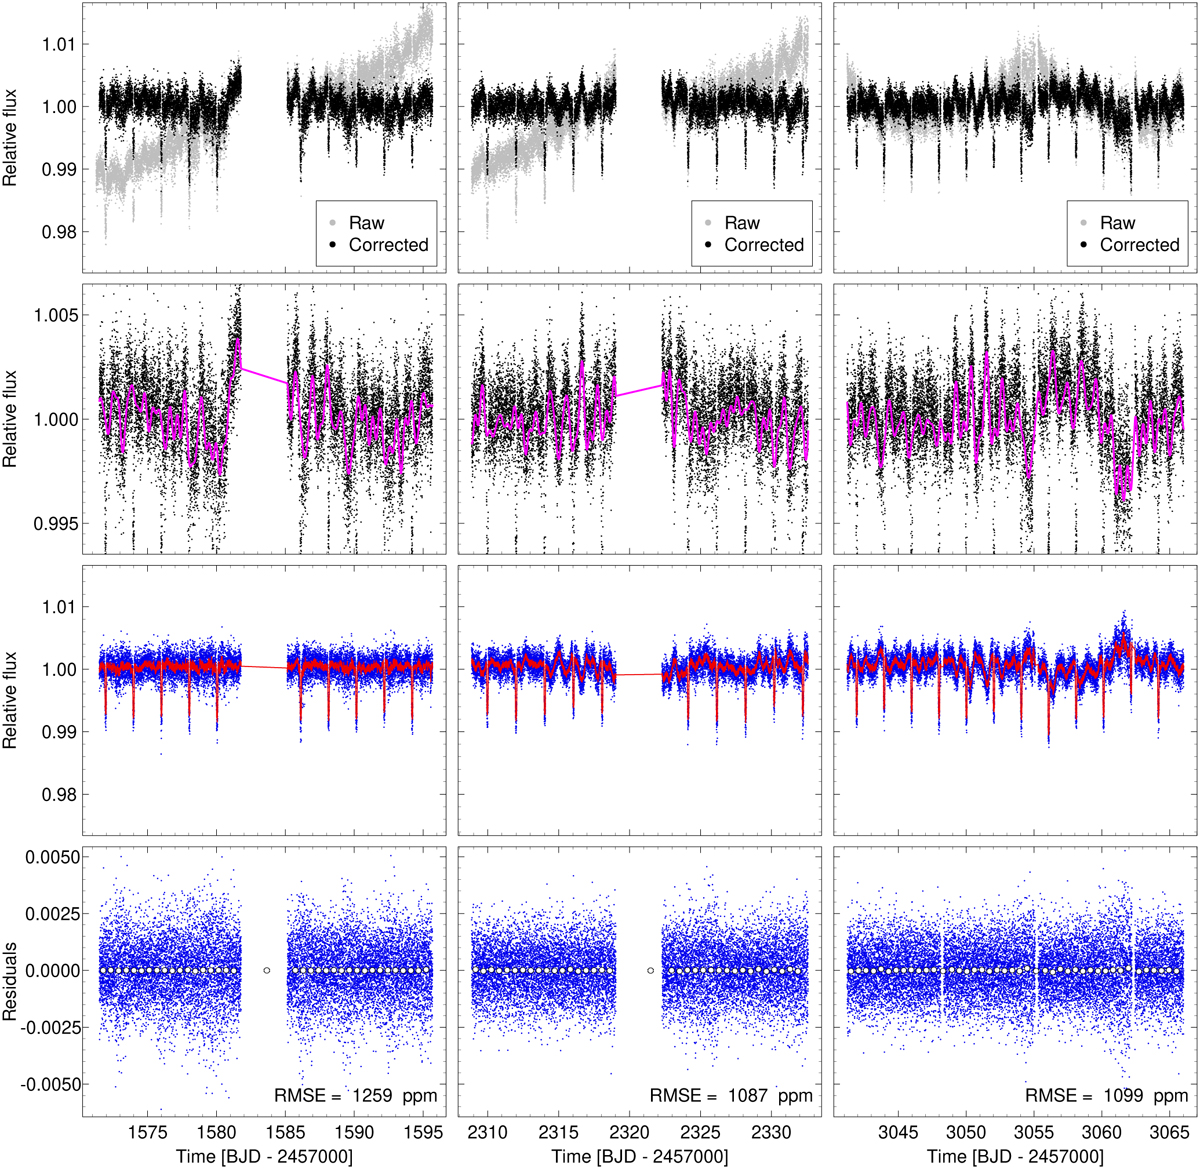
TESS simple aperture photometry light curve of WASP-167 (top row, grey dots) from Sectors 10 (left), 37 (middle), and 64 (right). The masked, detrended, and centroid-corrected LC is shown in black. The pulsation model, constructed from the 16 highest amplitude sinusoidal curves, is shown in the second row as a solid magenta line. The blue dots in the third row represent the LC when these 16 highest amplitude pulsations have been removed, while the best-fit combination of time-correlated noise and phase curve models are shown in red. The residuals, along with their root mean square error (RMSE) are shown in the bottom row.
Current usage metrics show cumulative count of Article Views (full-text article views including HTML views, PDF and ePub downloads, according to the available data) and Abstracts Views on Vision4Press platform.
Data correspond to usage on the plateform after 2015. The current usage metrics is available 48-96 hours after online publication and is updated daily on week days.
Initial download of the metrics may take a while.