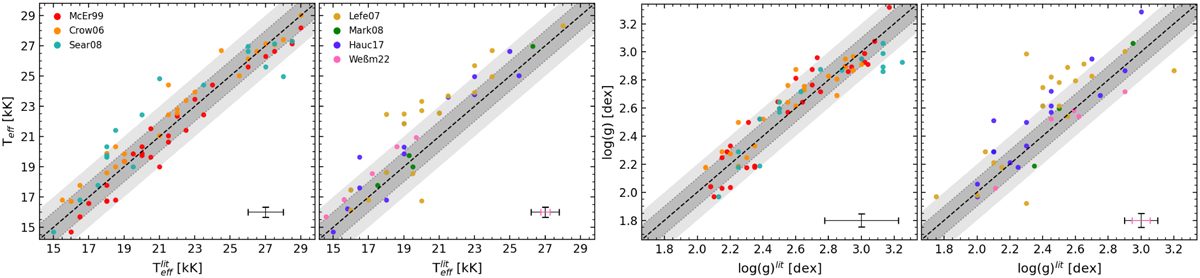
Fig. 5
Download original image
Comparison of the results of the Teff and log 𝑔 with previous studies in the literature. The acronyms follow those used in Table 4. The error bars in the bottom right corners indicate the average uncertainty from our analysis (vertical axis) or from the literature (horizontal axis) except for those from Weßmayer et al. (2022) for which a separate error bar in pink is included. The two shaded areas indicate a difference in Teff and log 𝑔 of 1000 K and 0.1 dex, and 2000 K and 0.2 dex, respectively. The diagonal black line indicates the 1-to-1 agreement.
Current usage metrics show cumulative count of Article Views (full-text article views including HTML views, PDF and ePub downloads, according to the available data) and Abstracts Views on Vision4Press platform.
Data correspond to usage on the plateform after 2015. The current usage metrics is available 48-96 hours after online publication and is updated daily on week days.
Initial download of the metrics may take a while.