Fig. 3
Download original image
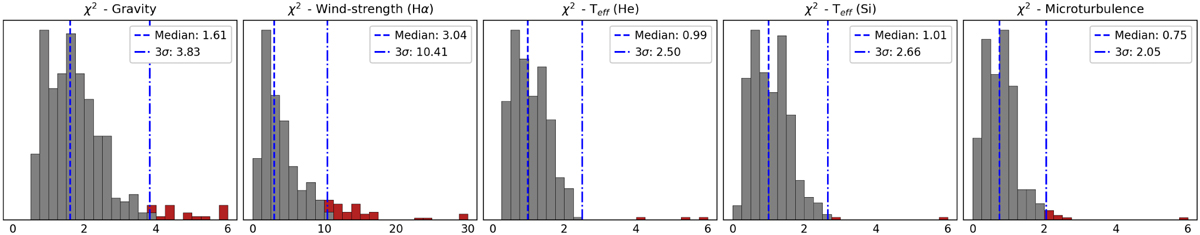
Histograms of the five quality indicators described in Sect. 3.2.5, each connected to a physical property, as indicated in the label of each panel. All histograms combine the information of all the stars with reliable estimates of Teff and log 𝑔. The gray bins correspond to values within 3-σ after applying an iterative clipping until convergence is achieved, while the red bins correspond to the clipped values. The median and 3-σ values are indicated in the figure with vertical and dash-dotted blue lines, respectively. The associated values are shown in the legend. For the panel associated with the wind strength, the x-axis extends to significantly higher values than for the others.
Current usage metrics show cumulative count of Article Views (full-text article views including HTML views, PDF and ePub downloads, according to the available data) and Abstracts Views on Vision4Press platform.
Data correspond to usage on the plateform after 2015. The current usage metrics is available 48-96 hours after online publication and is updated daily on week days.
Initial download of the metrics may take a while.