Fig. 14
Download original image
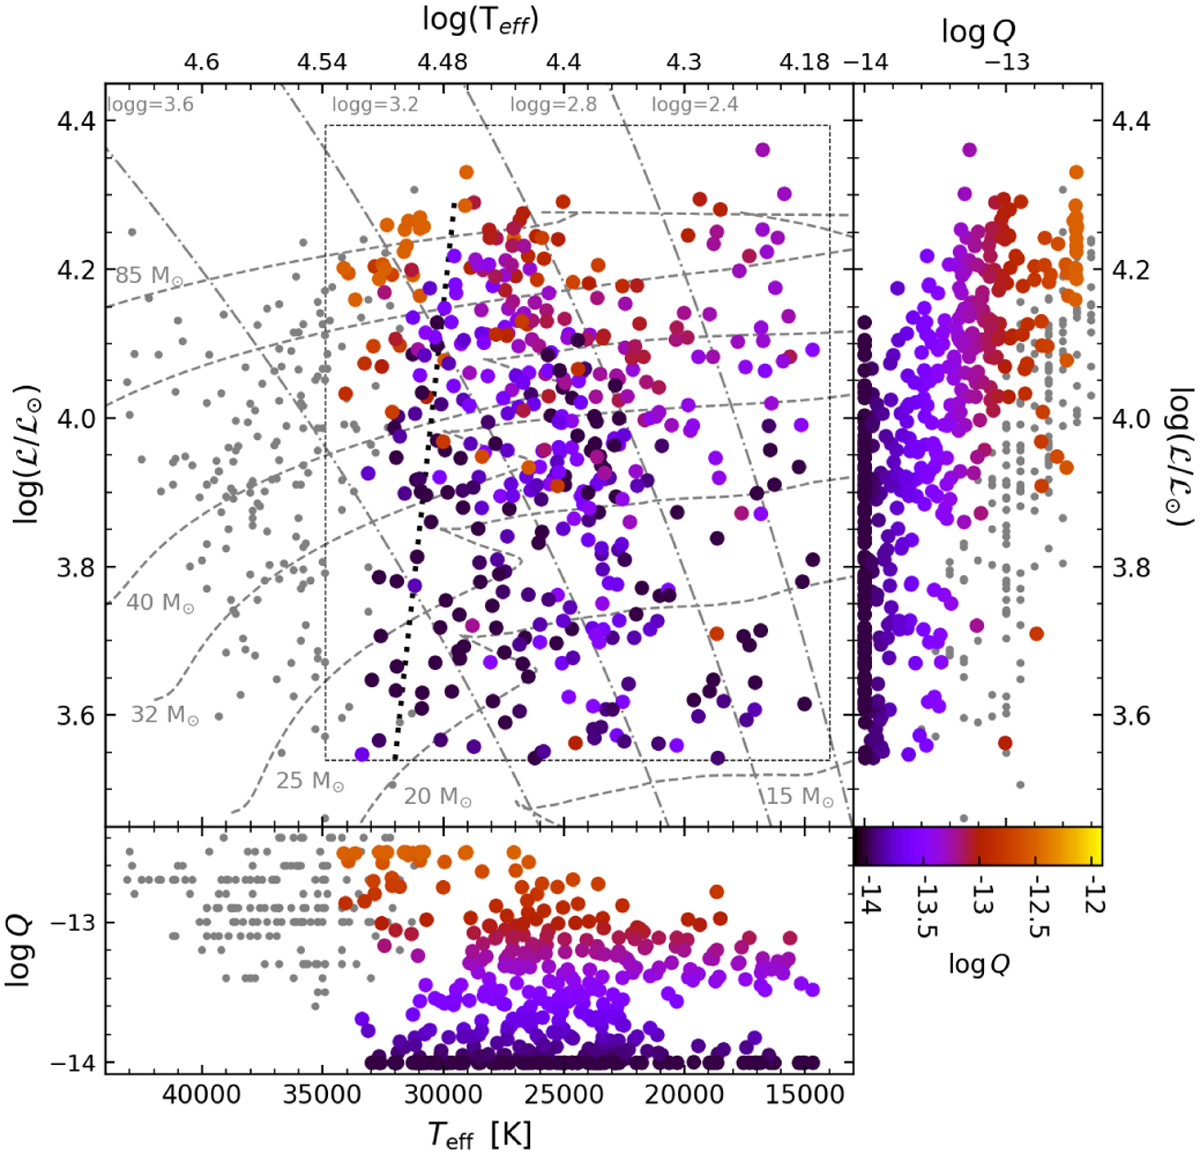
sHR diagram of the stars in the sample color-coded by log Q. The bottom and right subpanels in each panel show this quantity against Teff and log ℒ, respectively. Cases in which log Q is degenerate are excluded (see Sect. 4.1). All panels include 191 O-type stars from Hol18-22 (gray circles). The evolutionary tracks are the same as in Fig. 7 for Geneva models.
Current usage metrics show cumulative count of Article Views (full-text article views including HTML views, PDF and ePub downloads, according to the available data) and Abstracts Views on Vision4Press platform.
Data correspond to usage on the plateform after 2015. The current usage metrics is available 48-96 hours after online publication and is updated daily on week days.
Initial download of the metrics may take a while.