Open Access
Fig. 12
Download original image
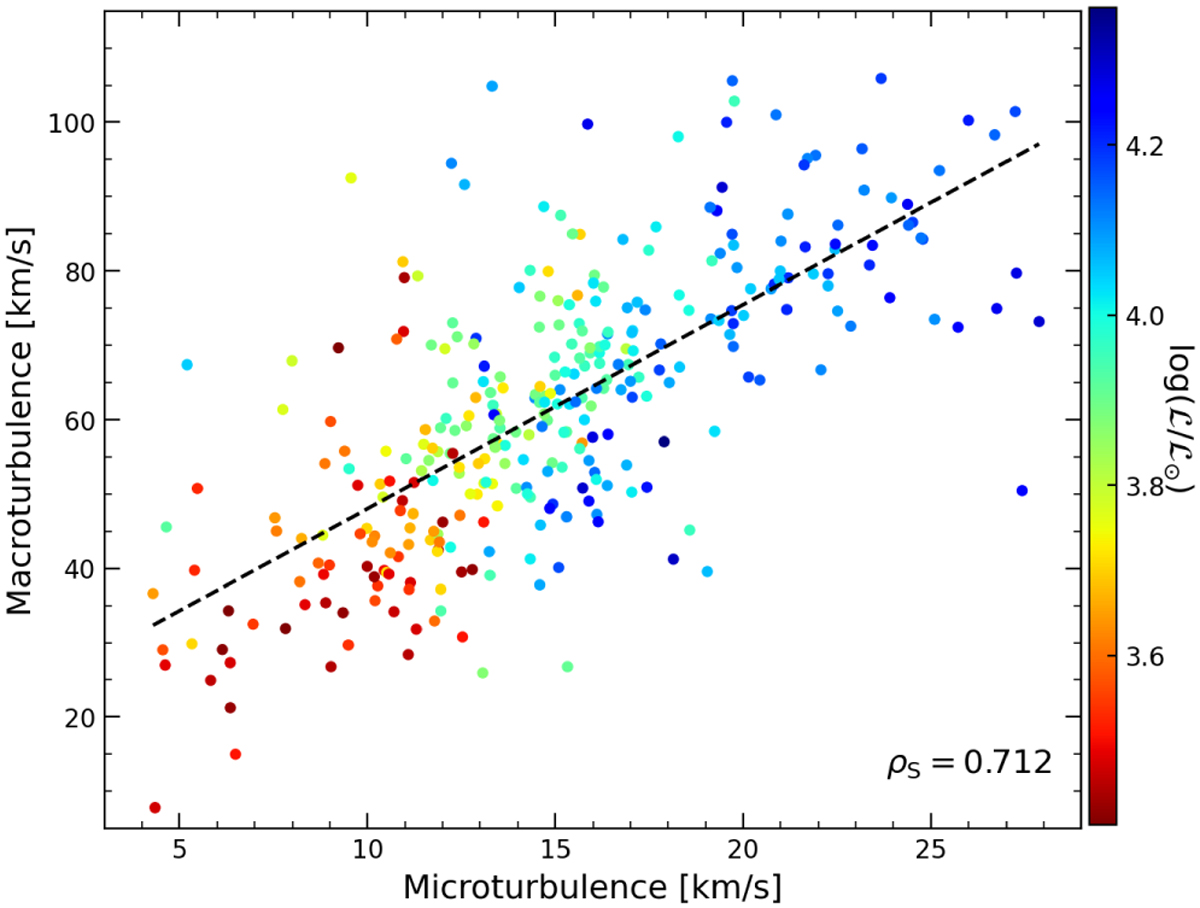
Macroturbulence against microturbulence for the sample of stars, color-coded by their log(ℒ/ℒ⊙). The sample is limited to those stars with υ sin i < 100 km s−1. A linear fit is included and is indicated by a dashed diagonal black line.
Current usage metrics show cumulative count of Article Views (full-text article views including HTML views, PDF and ePub downloads, according to the available data) and Abstracts Views on Vision4Press platform.
Data correspond to usage on the plateform after 2015. The current usage metrics is available 48-96 hours after online publication and is updated daily on week days.
Initial download of the metrics may take a while.