Fig. 1
Download original image
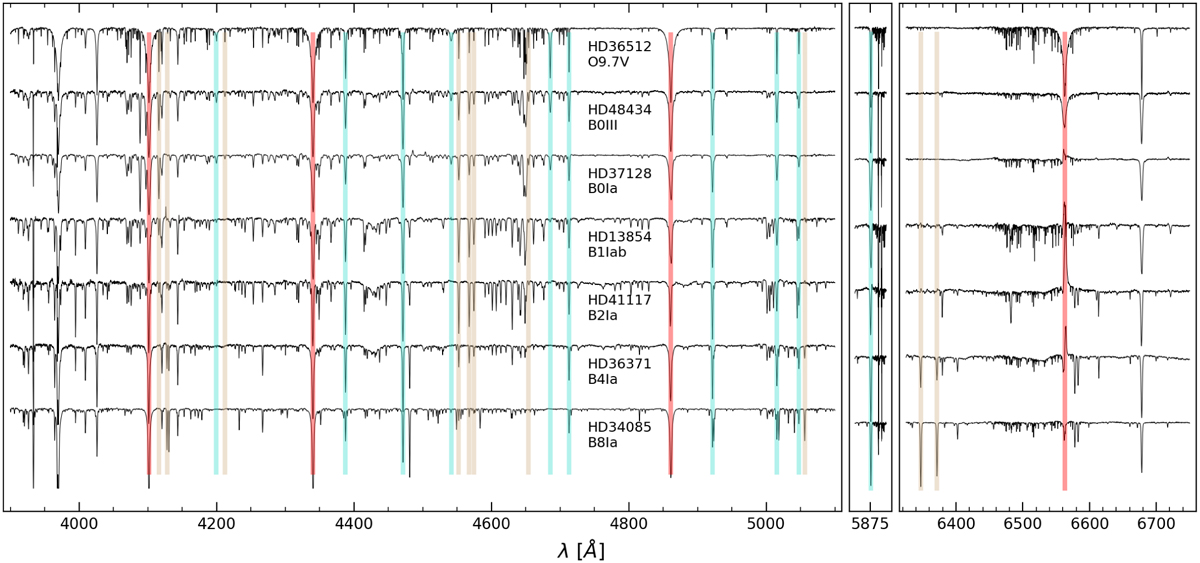
Some illustrative examples of spectra used in this work, ordered by spectral type. Three different spectral windows depict the wavelength ranges in which the main diagnostic lines used to obtain estimates of the spectroscopic parameters are located. The vertical red, cyan, and brown bars indicate the corresponding H I, He I–II, and Si II–III–IV lines (see Sect. 3.2.3 for further details).
Current usage metrics show cumulative count of Article Views (full-text article views including HTML views, PDF and ePub downloads, according to the available data) and Abstracts Views on Vision4Press platform.
Data correspond to usage on the plateform after 2015. The current usage metrics is available 48-96 hours after online publication and is updated daily on week days.
Initial download of the metrics may take a while.