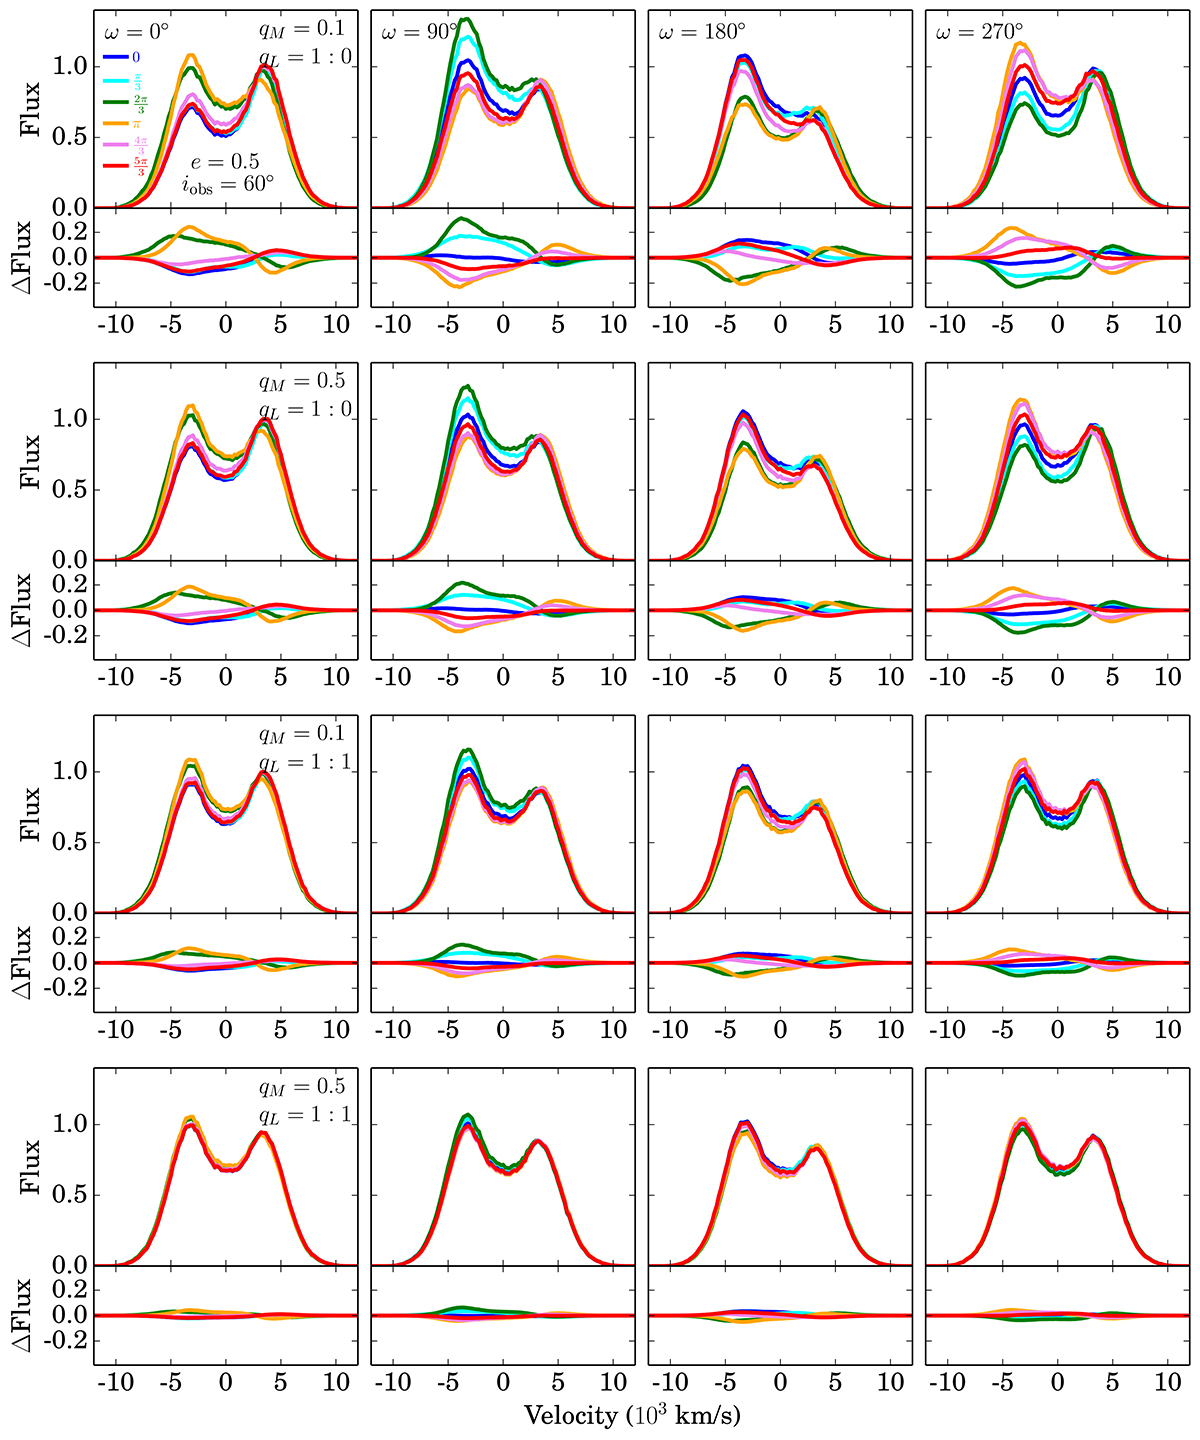
Fig. 5.
Download original image
Comparison of continuum light curves emitted by BBH systems when only the secondary BH is active (top two rows) and both the two BH are active (bottom two rows) for e = 0.5 and iobs = 60°. In each row, the top panels show the profiles at six phases (0 to 5π/3) in one period, and the relative flux variations are shown in the corresponding bottom panels as that in Fig. 4. Columns from left to right show the cases with ω = 0° ,90° ,180°, and 270°, which reflects the profile variations caused by different eccentricity vectors of the elliptical orbits observed at a fixed viewing angle.
Current usage metrics show cumulative count of Article Views (full-text article views including HTML views, PDF and ePub downloads, according to the available data) and Abstracts Views on Vision4Press platform.
Data correspond to usage on the plateform after 2015. The current usage metrics is available 48-96 hours after online publication and is updated daily on week days.
Initial download of the metrics may take a while.