Fig. 3.
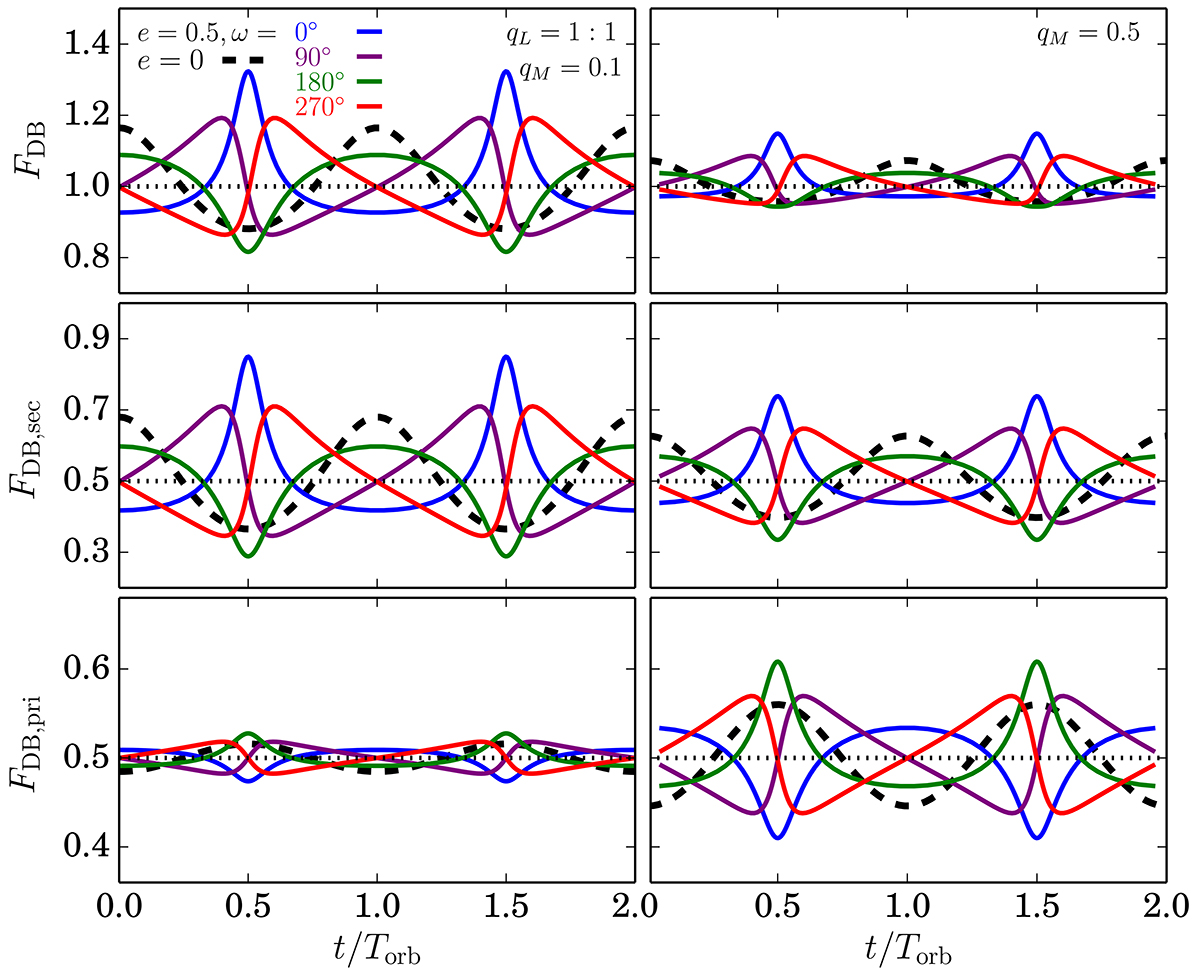
Download original image
Comparison of continuum light curves emitted by BBH systems when both the BHs are active, with qL = 1 : 1, iobs = 60°, qM = 0.1 (left column) and 0.5 (right column). The top panel shows the observed continuum light curve contributed by Doppler Boosting effect from the two co-rotating black holes. The Doppler boosted or weakened flux modulated by the secondary and the primary BHs are shown in the middle and bottom panels, respectively. The lines in different shapes and colors are the same as in Fig. 2.
Current usage metrics show cumulative count of Article Views (full-text article views including HTML views, PDF and ePub downloads, according to the available data) and Abstracts Views on Vision4Press platform.
Data correspond to usage on the plateform after 2015. The current usage metrics is available 48-96 hours after online publication and is updated daily on week days.
Initial download of the metrics may take a while.