Open Access
Fig. C.1.
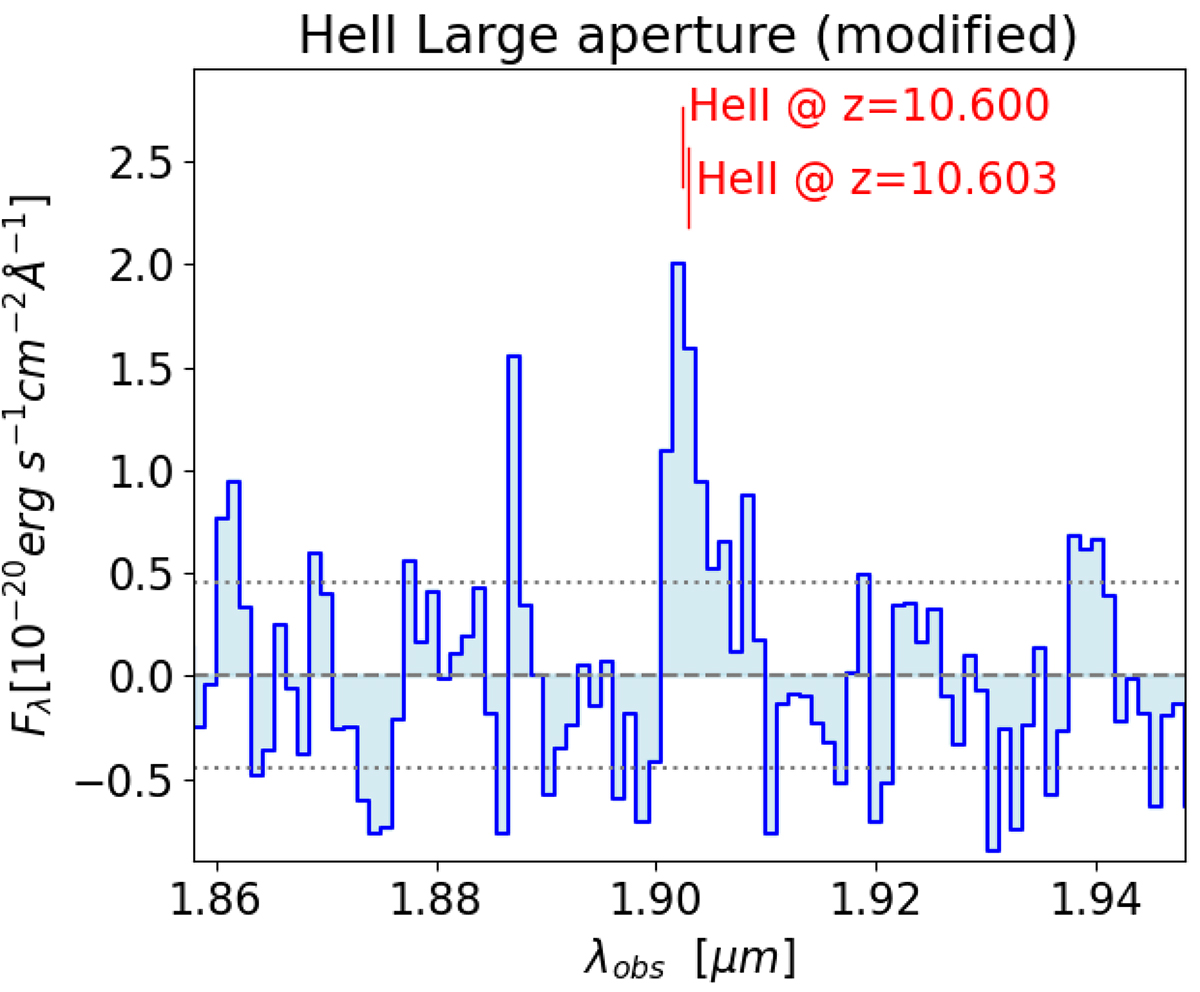
Download original image
Spectrum extracted from the same extracted aperture at the spectrum in the right panel of Fig.4, that is, the aperture marked in yellow in Fig.1 (Tab.2), but where the regions closer than 0.3″ to GN-z11 were excluded. The spectrum is essentially unchanged with respect to the spectrum extracted from the entire aperture.
Current usage metrics show cumulative count of Article Views (full-text article views including HTML views, PDF and ePub downloads, according to the available data) and Abstracts Views on Vision4Press platform.
Data correspond to usage on the plateform after 2015. The current usage metrics is available 48-96 hours after online publication and is updated daily on week days.
Initial download of the metrics may take a while.