Fig. 4.
Download original image
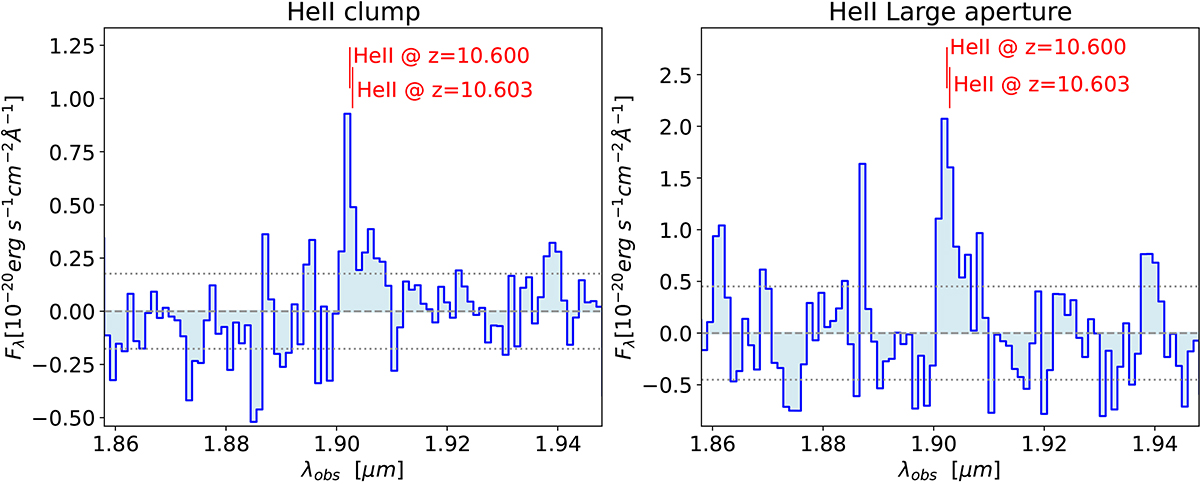
Spectra extracted from the apertures indicated in Fig. 1 and zoomed near the expected wavelength of HeII at the redshift of GN-z11. Specifically, the left panel shows the spectrum extracted from the aperture centred on the ‘HeII clump’ (red box in Fig. 1 and smaller white box in Fig. 3). The right panel shows the spectrum extracted from the larger aperture encompassing the extended HeII emission in the NE quadrant of GN-z11 (yellow box in Fig. 1 and larger white box in Fig. 3). The red vertical bars indicate the expected wavelength of HeII at the redshift of GN-z11, z = 10.603, and the wavelength of the centroid of the line in the clump, which, if identified as HeII, gives a redshift z = 10.600. The dotted lines indicate the noise per spectral pixel in each spectrum inferred from the rms directly measured in the spectrum around the HeII line.
Current usage metrics show cumulative count of Article Views (full-text article views including HTML views, PDF and ePub downloads, according to the available data) and Abstracts Views on Vision4Press platform.
Data correspond to usage on the plateform after 2015. The current usage metrics is available 48-96 hours after online publication and is updated daily on week days.
Initial download of the metrics may take a while.