Fig. 3.
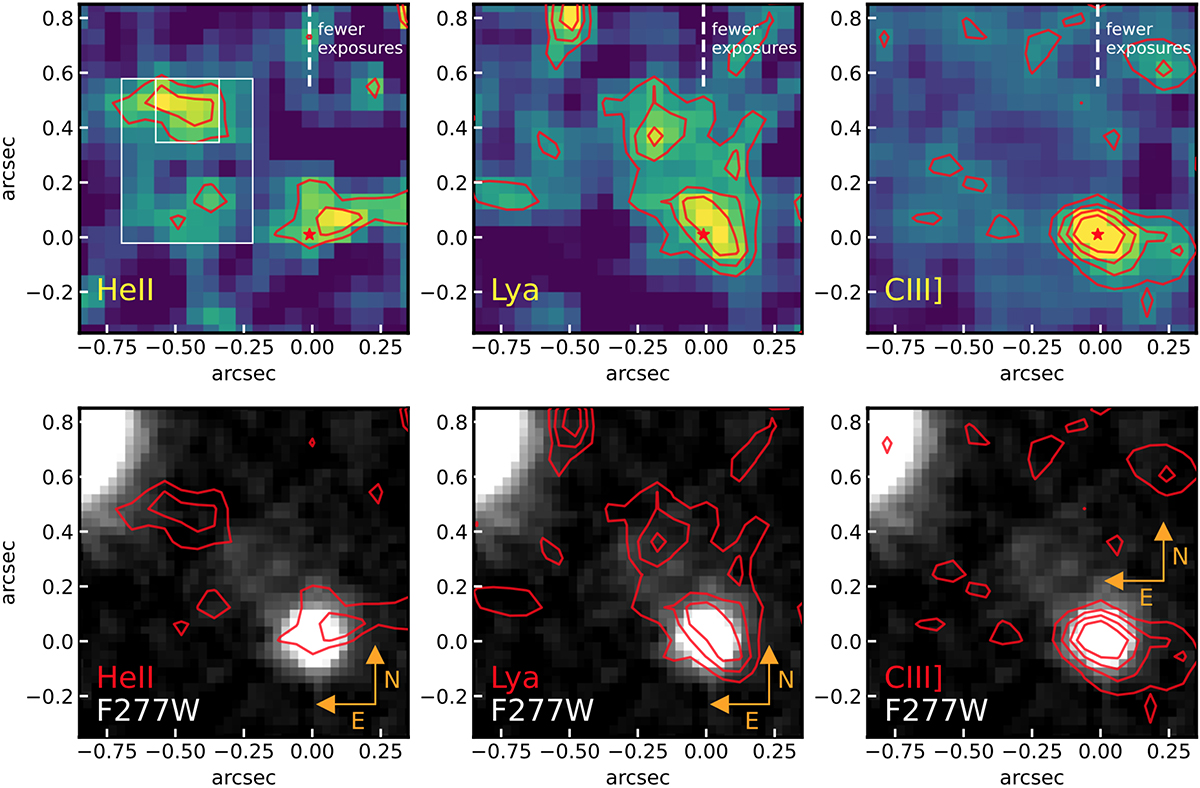
Download original image
Emission lines maps. Top panels: maps of the HeIIλ1640, Lyα, and CIII]λ1909 lines (see text for details). The red star marks the position of the continuum of GN-z11. Contours are at 2, 3, and 4σ for the HeII and Lyα maps and at 2, 4, 6, and 8σ for the CIII] map (the rms is estimated from the statistics in the IFU FoV, outside this region). We note that most of these spaxels are independent; hence the significance of the integrated emission of each feature is significantly higher. The two white boxes indicate the extraction apertures of the two spectra shown in Fig. 4 and marked in red and yellow in Fig. 1. The vertical dashed segment indicates the region beyond which there are fewer exposures because of the guiding problem discussed in Sect. 2. Bottom panels: overlay of the contours from the emission line maps onto the F277W NIRCam map from Tacchella et al. (2023).
Current usage metrics show cumulative count of Article Views (full-text article views including HTML views, PDF and ePub downloads, according to the available data) and Abstracts Views on Vision4Press platform.
Data correspond to usage on the plateform after 2015. The current usage metrics is available 48-96 hours after online publication and is updated daily on week days.
Initial download of the metrics may take a while.