Fig. 2.
Download original image
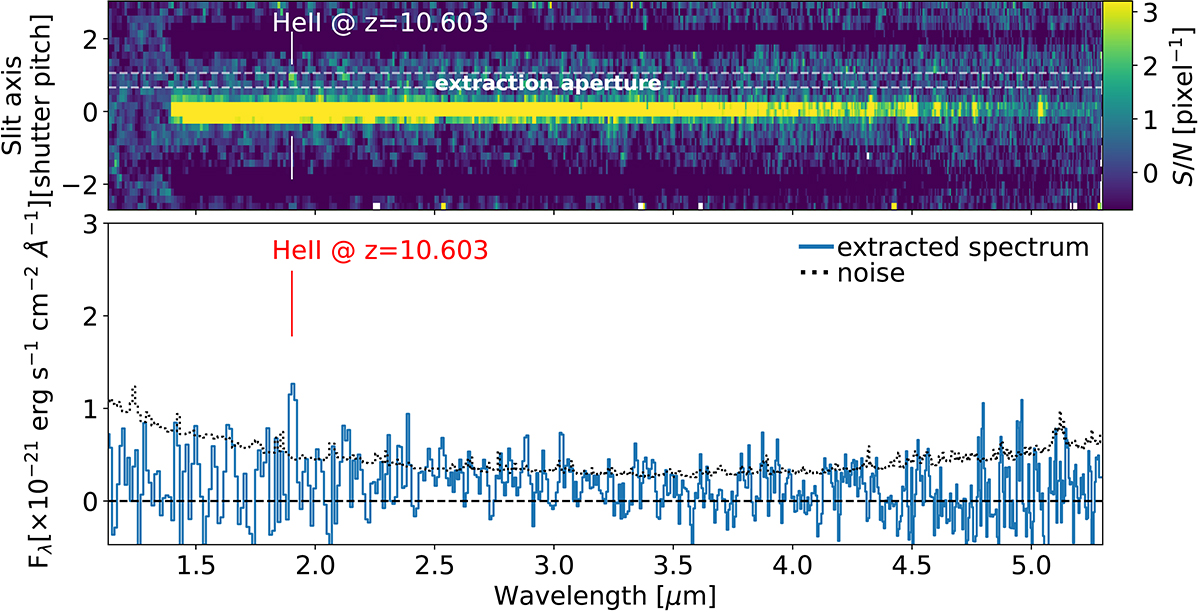
Prism spectrum of the region to the north-east of GN-z11, from the February 2023 MSA observation. Top panel: signal-to-noise 2D prism spectrum of GN-z11. The spectrum has been obtained by using only the exposures in which GN-z11 is in the upper and lower shutters (hence discarding the exposure with GN-z11 in the central shutter) as to avoid self-subtraction of the extended signal. Bottom panel: one-dimensional spectrum extracted from the region delimited by the two dashed horizontal lines, at about 0.45″ from GN-z11 in the NE direction, illustrating the tentative detection (3.7σ integrated) of a feature at 1.903 μm. The red vertical line indicates the location of HeIIλ1640 expected at the redshift of GN-z11, z = 10.603 (which is indistinguishable from the redshift of 10.600 inferred for the grating spectrum).
Current usage metrics show cumulative count of Article Views (full-text article views including HTML views, PDF and ePub downloads, according to the available data) and Abstracts Views on Vision4Press platform.
Data correspond to usage on the plateform after 2015. The current usage metrics is available 48-96 hours after online publication and is updated daily on week days.
Initial download of the metrics may take a while.