Fig. 9
Download original image
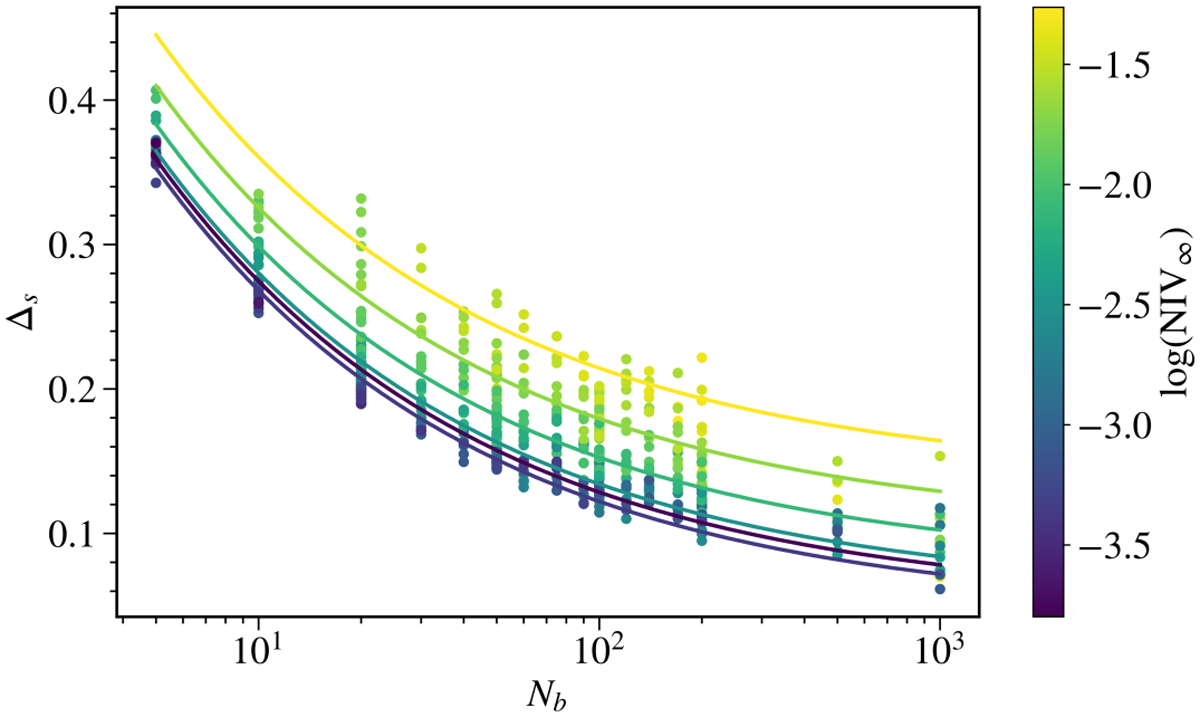
Dependence of ∆s on the number of bins, and the NIV∞. Each data point represents the intrinsic scatter in the NIV, determined from 2000 light curves, randomly selected from a 105 bin simulated pink-noise light curve produced from a constant input PSD. The curves show the best fit relation of ∆s(Nb), at fixed levels of NIV∞, using Eq. (10) with parameter values as contained in Table 2. There is a significant scatter among the data points due to the probabilistic nature of this estimate.
Current usage metrics show cumulative count of Article Views (full-text article views including HTML views, PDF and ePub downloads, according to the available data) and Abstracts Views on Vision4Press platform.
Data correspond to usage on the plateform after 2015. The current usage metrics is available 48-96 hours after online publication and is updated daily on week days.
Initial download of the metrics may take a while.