Fig. 8
Download original image
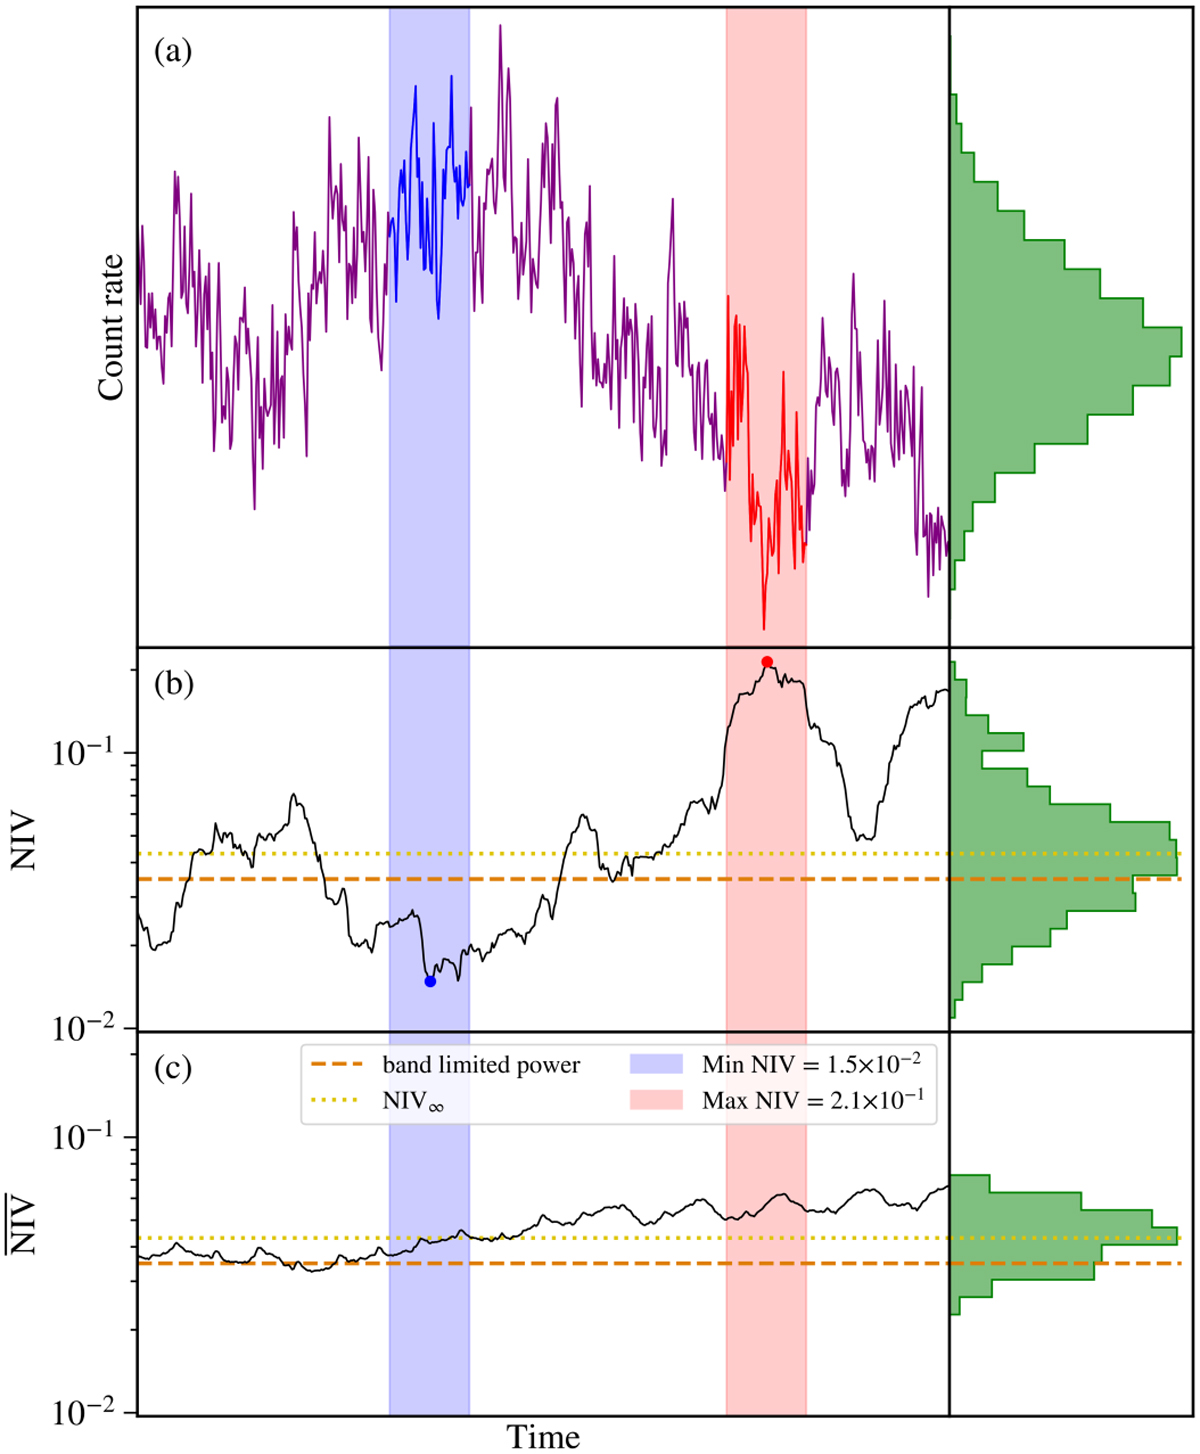
Simulated light curve demonstrating how the NIV of a variable source can change over time, even if the PSD and the band-limited power remain unchanged. Panel a: 500-bin segment of a simulated pink-noise light curve without measurement errors or Poisson noise. Panel b: Normalised intrinsic variance of a sliding window interval of 50 bins from the light curve in panel a. Each NIV data point is placed at the time of centre of the selected interval. The maximum and minimum NIV of this interval is indicated, and the parts of the light curve for which they were obtained are highlighted. Panel c: Geometric mean NIV of 10 adjoined segments, each consisting of 50 bins. Each value is placed at the center of the segments used. Panels b and c use data from the light curve outside of the interval shown in panel a. The panels on the right show the distribution of these parameters, throughout the entire 5 × 10³ bin simulated light curve.
Current usage metrics show cumulative count of Article Views (full-text article views including HTML views, PDF and ePub downloads, according to the available data) and Abstracts Views on Vision4Press platform.
Data correspond to usage on the plateform after 2015. The current usage metrics is available 48-96 hours after online publication and is updated daily on week days.
Initial download of the metrics may take a while.