Fig. 7
Download original image
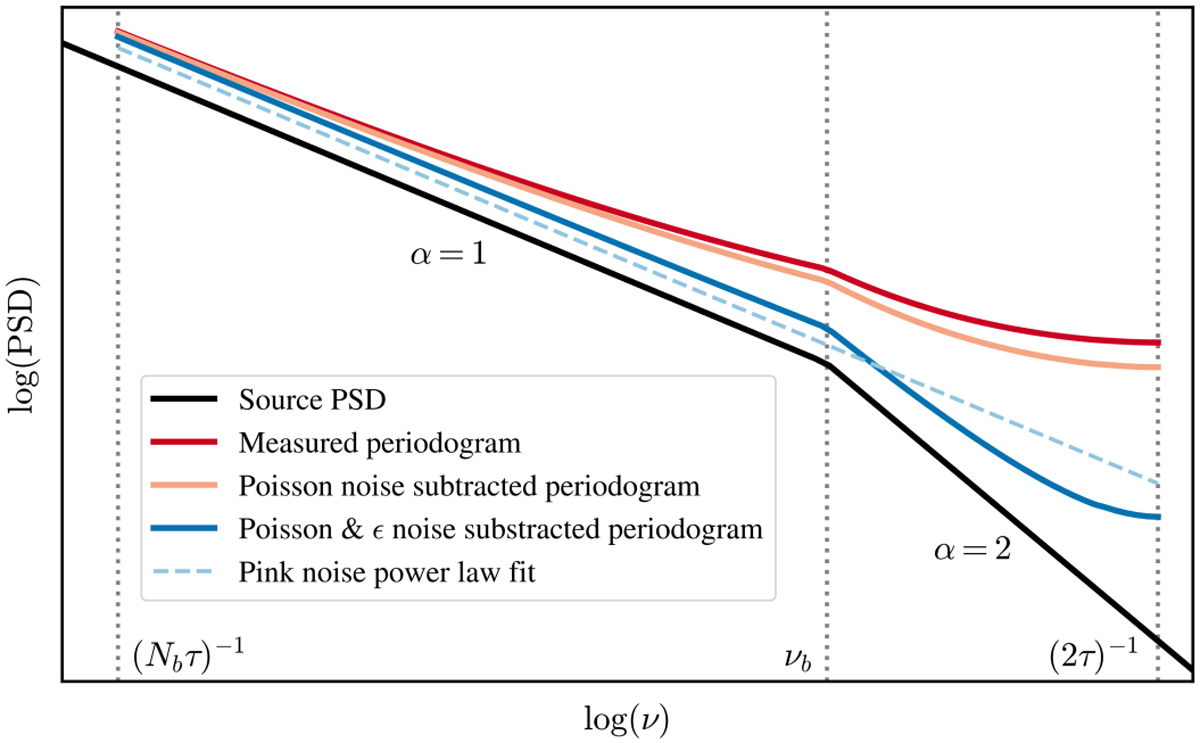
Comparison of a typical AGN PSD, and how a measured peri-odogram differs from it, within the frequency space that can be explored by eROSITA for sources lying close to the ecliptic poles. The intrinsic PSD is depicted as following a broken power-law of P ∝ v−1 at v < vb, and P ∝ v−2 at v ≥ vb, and continues beyond the frequency range probed by the observations. The measured periodogram is offset from the intrinsic PSD by the Poisson noise, the є noise, aliasing, and the red noise leak. The є noise (Eq. (16)) is often significantly larger than the Poisson noise (Eq. (15)). The flattening of the Poisson and є subtracted periodogram at the highest frequencies is due to aliasing. The red noise leak increases the amplitude of the power-laws. The relative strength of the Poisson, fractional-exposure noise, aliasing, and the red noise leak depicted in this figure are illustrative, and depend on the shape of the PSD, the average count rate, and the mean, and variance of the fractional exposure. Periodogram noise is not depicted.
Current usage metrics show cumulative count of Article Views (full-text article views including HTML views, PDF and ePub downloads, according to the available data) and Abstracts Views on Vision4Press platform.
Data correspond to usage on the plateform after 2015. The current usage metrics is available 48-96 hours after online publication and is updated daily on week days.
Initial download of the metrics may take a while.