Fig. 5
Download original image
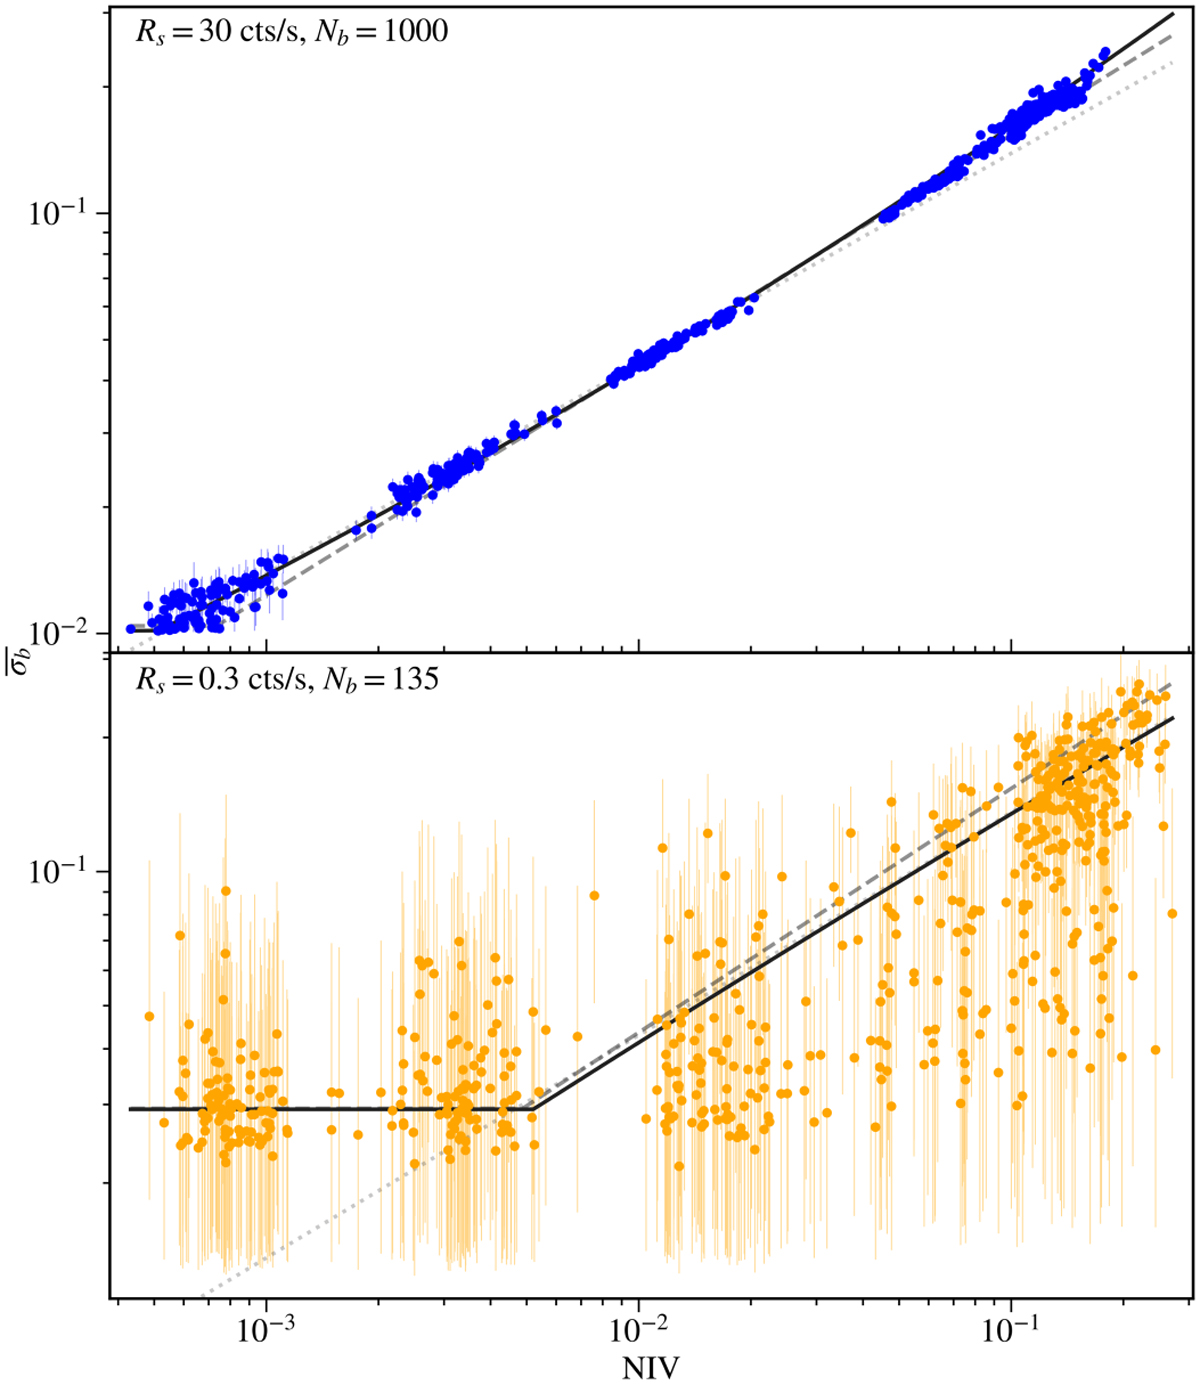
Relationship between ![]() and the NIV in simulated pink-noise eROSITA-like light curves. The relationship depends on both the number of bins and the count rate, so this figure showcases two examples. The top panel depicts the relationship for 1000-bin light curves with a mean count rate of 30 cts s−1. The lower panel shows the relationship for light curves of 135 bins, with a mean count rate of 0.3 cts s−1. The solid black line depicts the best fit of
and the NIV in simulated pink-noise eROSITA-like light curves. The relationship depends on both the number of bins and the count rate, so this figure showcases two examples. The top panel depicts the relationship for 1000-bin light curves with a mean count rate of 30 cts s−1. The lower panel shows the relationship for light curves of 135 bins, with a mean count rate of 0.3 cts s−1. The solid black line depicts the best fit of ![]() , using Eq. (6) and the parameters listed in Table 1. The dashed line represents using a simpler version of Eq. (6), in which the parameters a, b, and c are constant. The dotted line shows the fit of
, using Eq. (6) and the parameters listed in Table 1. The dashed line represents using a simpler version of Eq. (6), in which the parameters a, b, and c are constant. The dotted line shows the fit of ![]() for simulated values of NIV above the detection limit.
for simulated values of NIV above the detection limit.
Current usage metrics show cumulative count of Article Views (full-text article views including HTML views, PDF and ePub downloads, according to the available data) and Abstracts Views on Vision4Press platform.
Data correspond to usage on the plateform after 2015. The current usage metrics is available 48-96 hours after online publication and is updated daily on week days.
Initial download of the metrics may take a while.