Fig. 2
Download original image
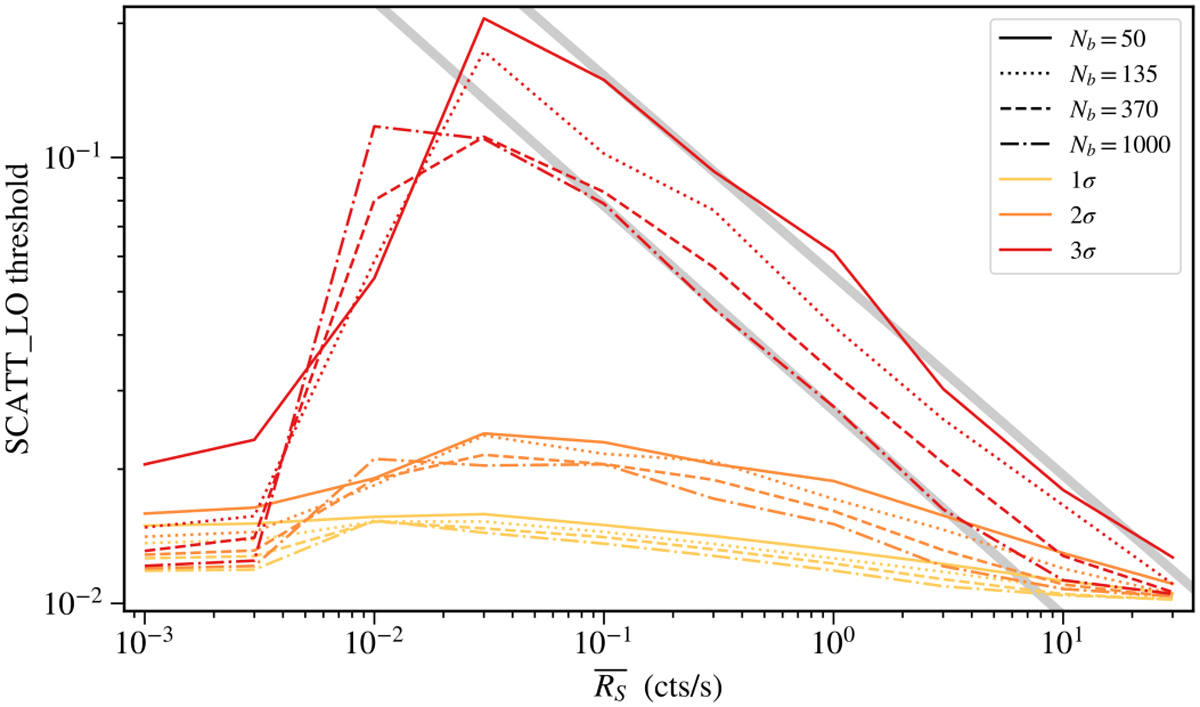
1, 2, and 3σ thresholds on SCATT_LO for identifying variable sources. The thresholds are displayed as a function of the count rate. The dependence on the number of bins is illustrated by using different line styles. The grey lines indicate the best fit power-law relationship to the decreasing thresholds with increasing count rate, above the peak.
Current usage metrics show cumulative count of Article Views (full-text article views including HTML views, PDF and ePub downloads, according to the available data) and Abstracts Views on Vision4Press platform.
Data correspond to usage on the plateform after 2015. The current usage metrics is available 48-96 hours after online publication and is updated daily on week days.
Initial download of the metrics may take a while.